Scenario
This lab takes you into the world of voice communications on the internet. VoIP is becoming the de-facto standard for voice communication. As this technology becomes more common, malicious parties have more opportunities and stronger motives to control these systems to conduct nefarious activities. This challenge was designed to examine and explore some of the attributes of the SIP and RTP protocols.
Two artifacts ship with the lab:
log.txtwas generated by an unadvertised, passive honeypot on the internet, so every SIP message in it is hostile by definition. The honeypot's own address is masked ashoney.pot.IP.removed, external addresses have octets replaced withX, trailing digits of phone numbers are replaced withX, and the MD5 in every authorization digest is replaced withMD5_hash_removedXXXXXXXXXXXXXXXX. Timestamps are UTC.Voip-trace.pcapwas created by Honeynet members for this challenge on a separate lab network.
Note: these are two different environments,
log.txtis the internet honeypot: it holds SIP requests only (no responses), spans 2010-05-02 to 2010-05-05, and involves two external sources.Voip-trace.pcapis a small lab network in172.25.105.0/24captured on 2010-05-01, and it holds SIP, RTP, RTCP and HTTP. Questions 2, 4, 5, 6, 7 and 8 are answered from the log. Questions 1, 3, 9, 10, 11, 12, 13 and 14 are answered from the capture. Each has its own SIP client, and they are not the same product.
The commands in this walkthrough are plain grep pipelines, exactly as the lab hints suggest. On Windows they run unchanged under WSL, Git Bash, or any Linux VM with the lab folder mounted.
Q1: What is the transport protocol being used?
What do we need to know?
A VoIP call is two conversations, not one. SIP carries the signalling: it sets the call up, negotiates what codec both ends will speak, and tears the call down. RTP carries the audio itself. They run on different ports and are dissected as different protocols, but the question is about the layer underneath both of them.
Real-time audio cannot tolerate retransmission. A voice packet that arrives late is worse than useless, because the moment it was meant to be played has already passed. So VoIP deliberately gives up delivery guarantees in exchange for latency, which points at one specific transport.
Two traps live in this question. The first is answering with an application protocol instead of a transport protocol: SIP and RTP are what you see in the Protocol column, but neither is a transport. The second is that this capture also contains a web administration session, and that traffic genuinely does use the other transport, so "which transport appears in the file" is not the same question as "which transport is carrying the VoIP".
How to do that?
- Open
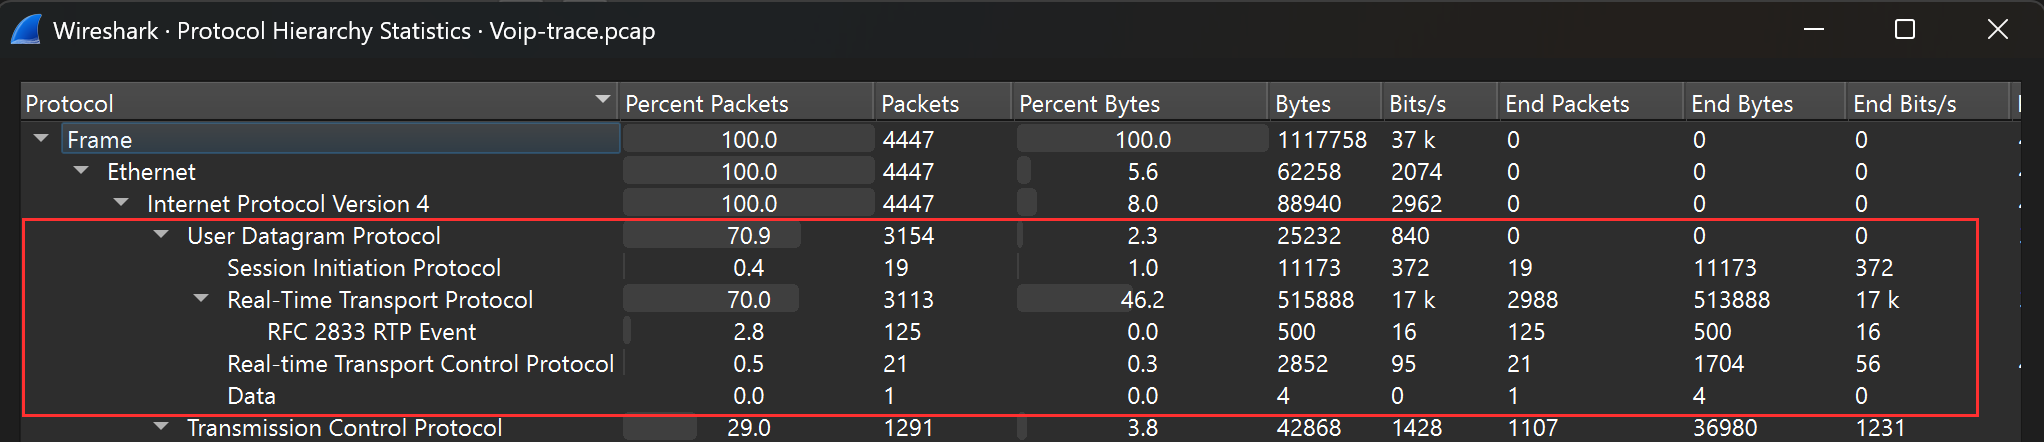
Voip-trace.pcapand go to Statistics > Protocol Hierarchy. This renders the whole capture as a tree of encapsulation, parent above child, so you can read straight off it which protocol is carrying which.
-
Find the two branches under IPv4 and compare them. One branch carries roughly seventy percent of the packets and has SIP, RTP, RTP Event and RTCP hanging off it. The other carries the web session. The parent of the VoIP branch is your answer, and the boxed subtree above is that branch.
-
Confirm it on a single packet rather than trusting the summary. Apply this display filter, select the first packet, and read the layer stack in the packet detail pane:
sip || rtp
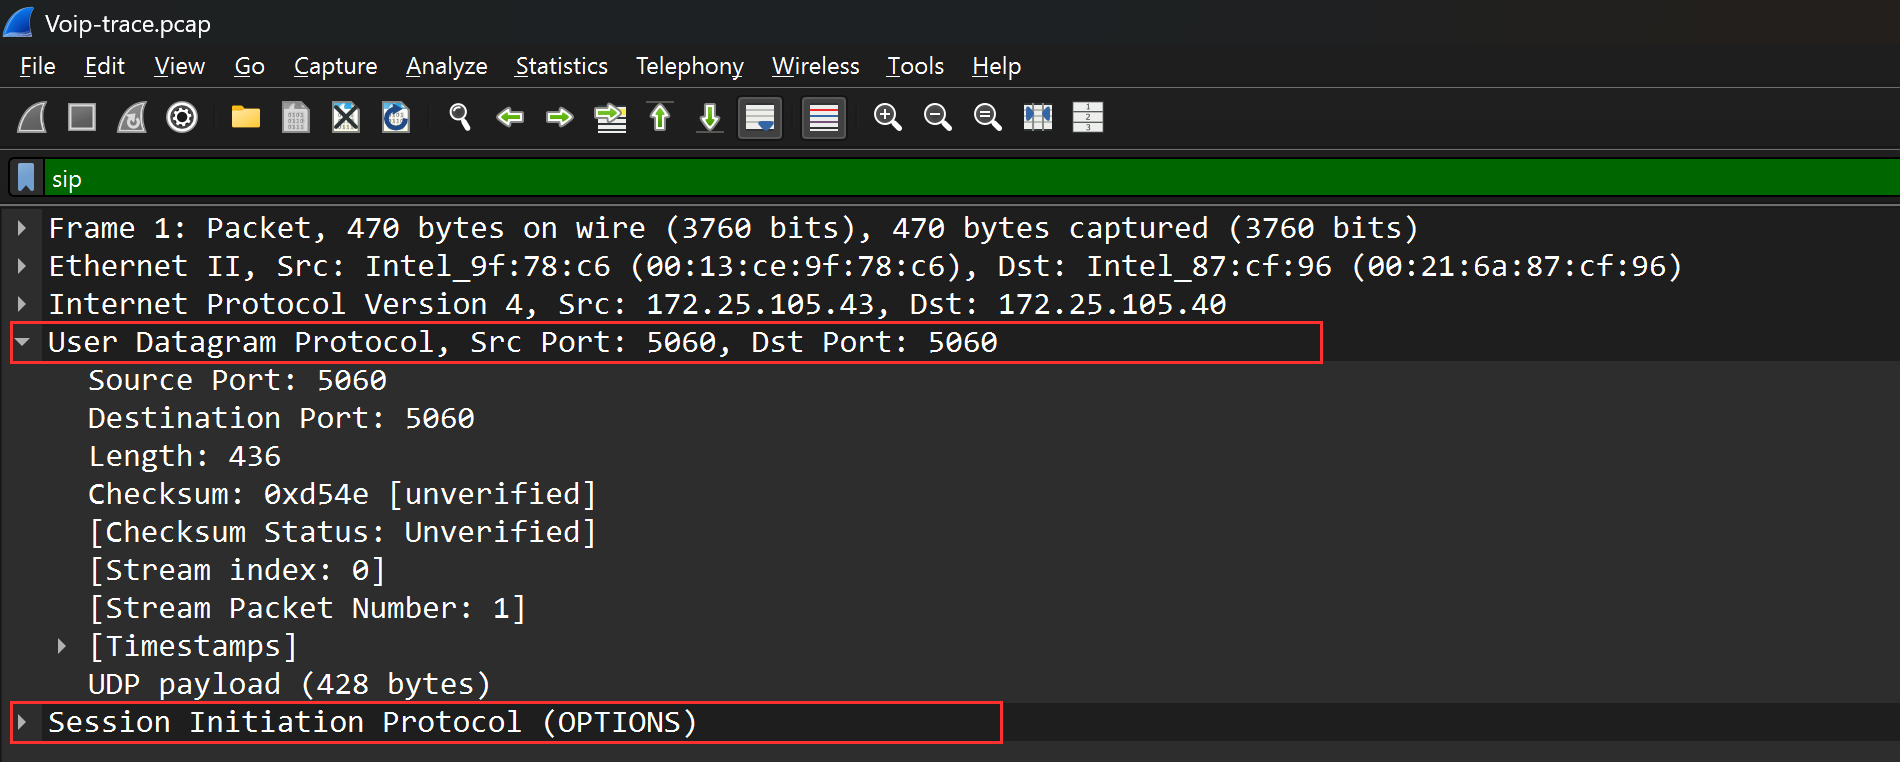
- Submit the transport-layer protocol, using its three-letter abbreviation rather than its full name.
Q2: The attacker used a bunch of scanning tools that belong to the same suite. Provide the name of the suite.
What do we need to know?
Every SIP request carries a User-Agent header, the same idea as the HTTP header of that name. It is self-reported and trivially changed, which is exactly why it is such a good fingerprint: attackers running a tool straight out of the box rarely bother to change it, and the tool's default string becomes a signature.
The honeypot is unadvertised, so every message in log.txt is hostile. If almost all of them share one User-Agent, that string names the tool that produced them.
Read the question carefully. It asks for the name of the suite, not the
User-Agentstring you will find. The string is the default agent name of one well-known open-source VoIP auditing toolkit, and submitting the raw string instead of the project name is the most common near-miss on this question.
How to do that?
-
Tally every
User-Agentvalue in the log at once:grep -h '^User-Agent:' log.txt | sort | uniq -c | sort -rnOnly two distinct values come back out of thousands of messages. The overwhelming majority share one string, and that is the scanner.

-
Look at the very first message in the file for context. It is an
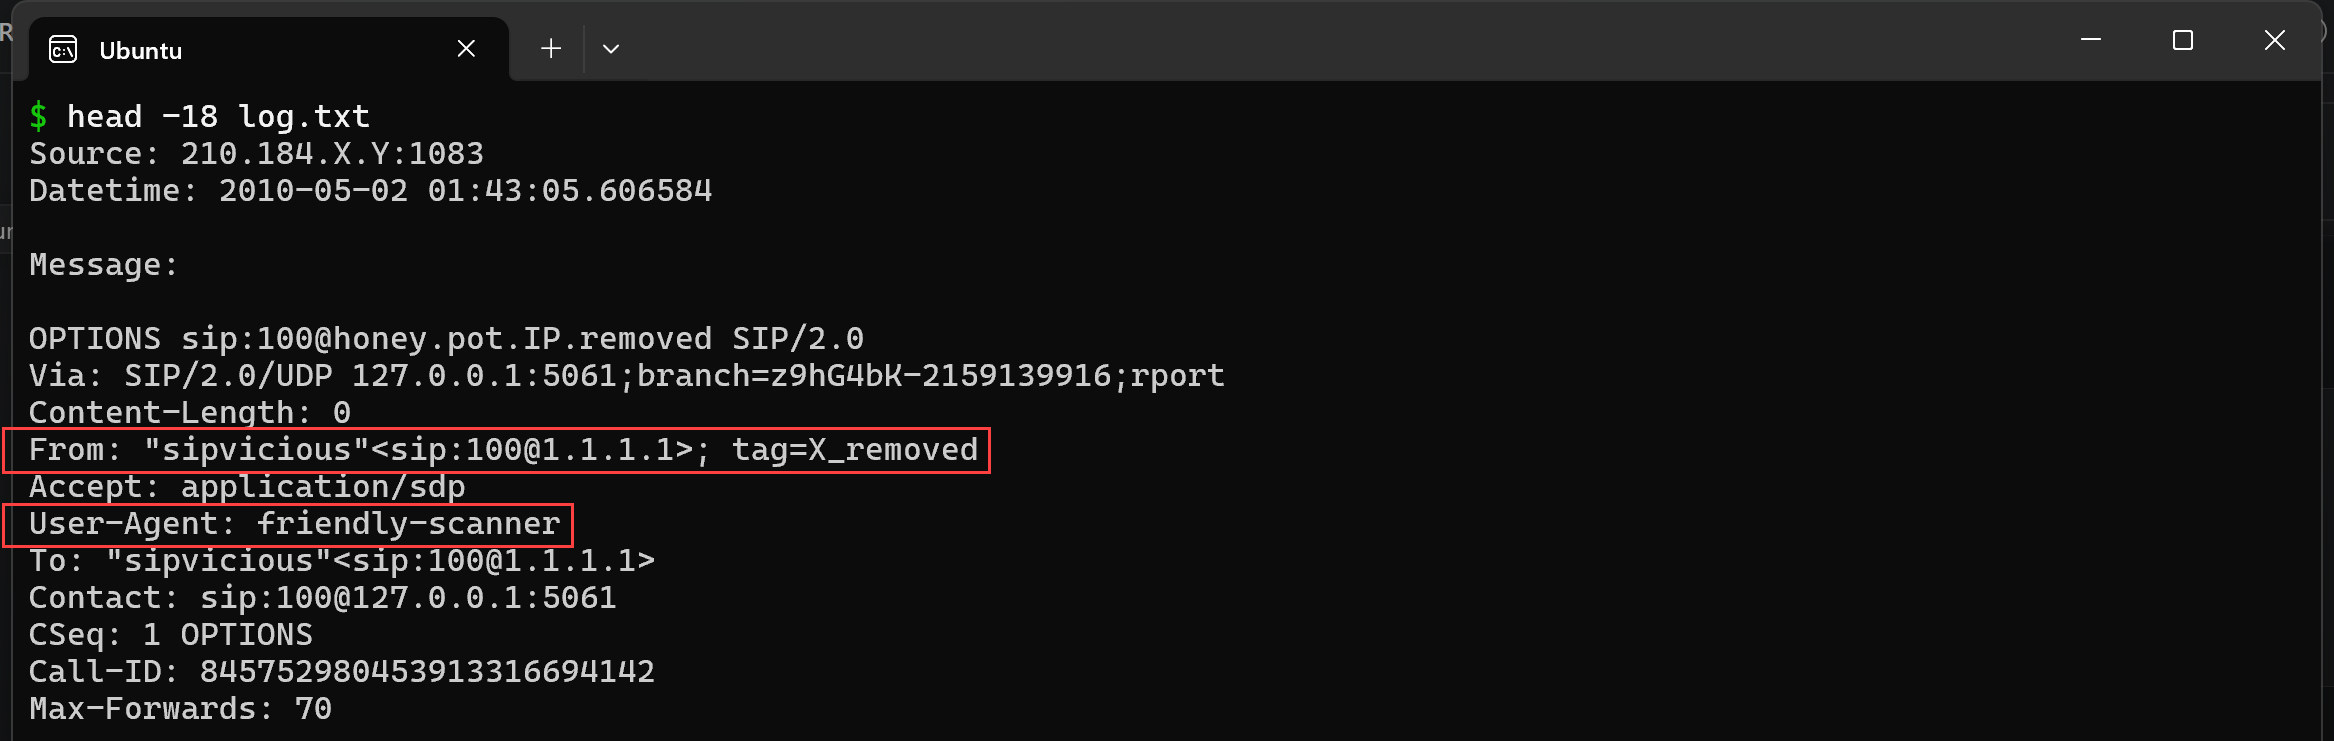
OPTIONSprobe, the cheapest possible way to ask a SIP server "are you alive":head -18 log.txtTwo headers in that block point the same way. The
User-Agentis the tool's default, and theFromdisplay name is the project's own name, left in place by whoever ran it.
- The
Fromdisplay name in that first packet is effectively the answer written out for you. Submit it capitalised the way the project itself writes it, as one word.
Q3: What is the User-Agent of the victim system?
What do we need to know?
This question is about the capture, not the log, and it turns on identifying which host is the victim. The victim is the PBX under attack, which means it is the host that answers rather than the one that asks.
There are four different User-Agent strings in this pcap and only one of them belongs to the victim:
| Where you see it | Whose it is |
|---|---|
The OPTIONS request in the very first packet |
the scanner probing the box |
| Every SIP response from the server | the PBX itself |
The REGISTER, SUBSCRIBE and INVITE requests later on |
a softphone on the lab network |
| The HTTP requests to the web interface | the attacker's browser |
Three of those four appear in the wrong-answer list for this question, so getting the direction right is the whole exercise.
How to do that?
-
Isolate SIP messages that carry the header, and add it as a column so you can read every value at a glance. Right-click the
User-Agentfield in the packet detail and choose Apply as Column, or add a custom column forsip.User-Agent:sip.User-Agent -
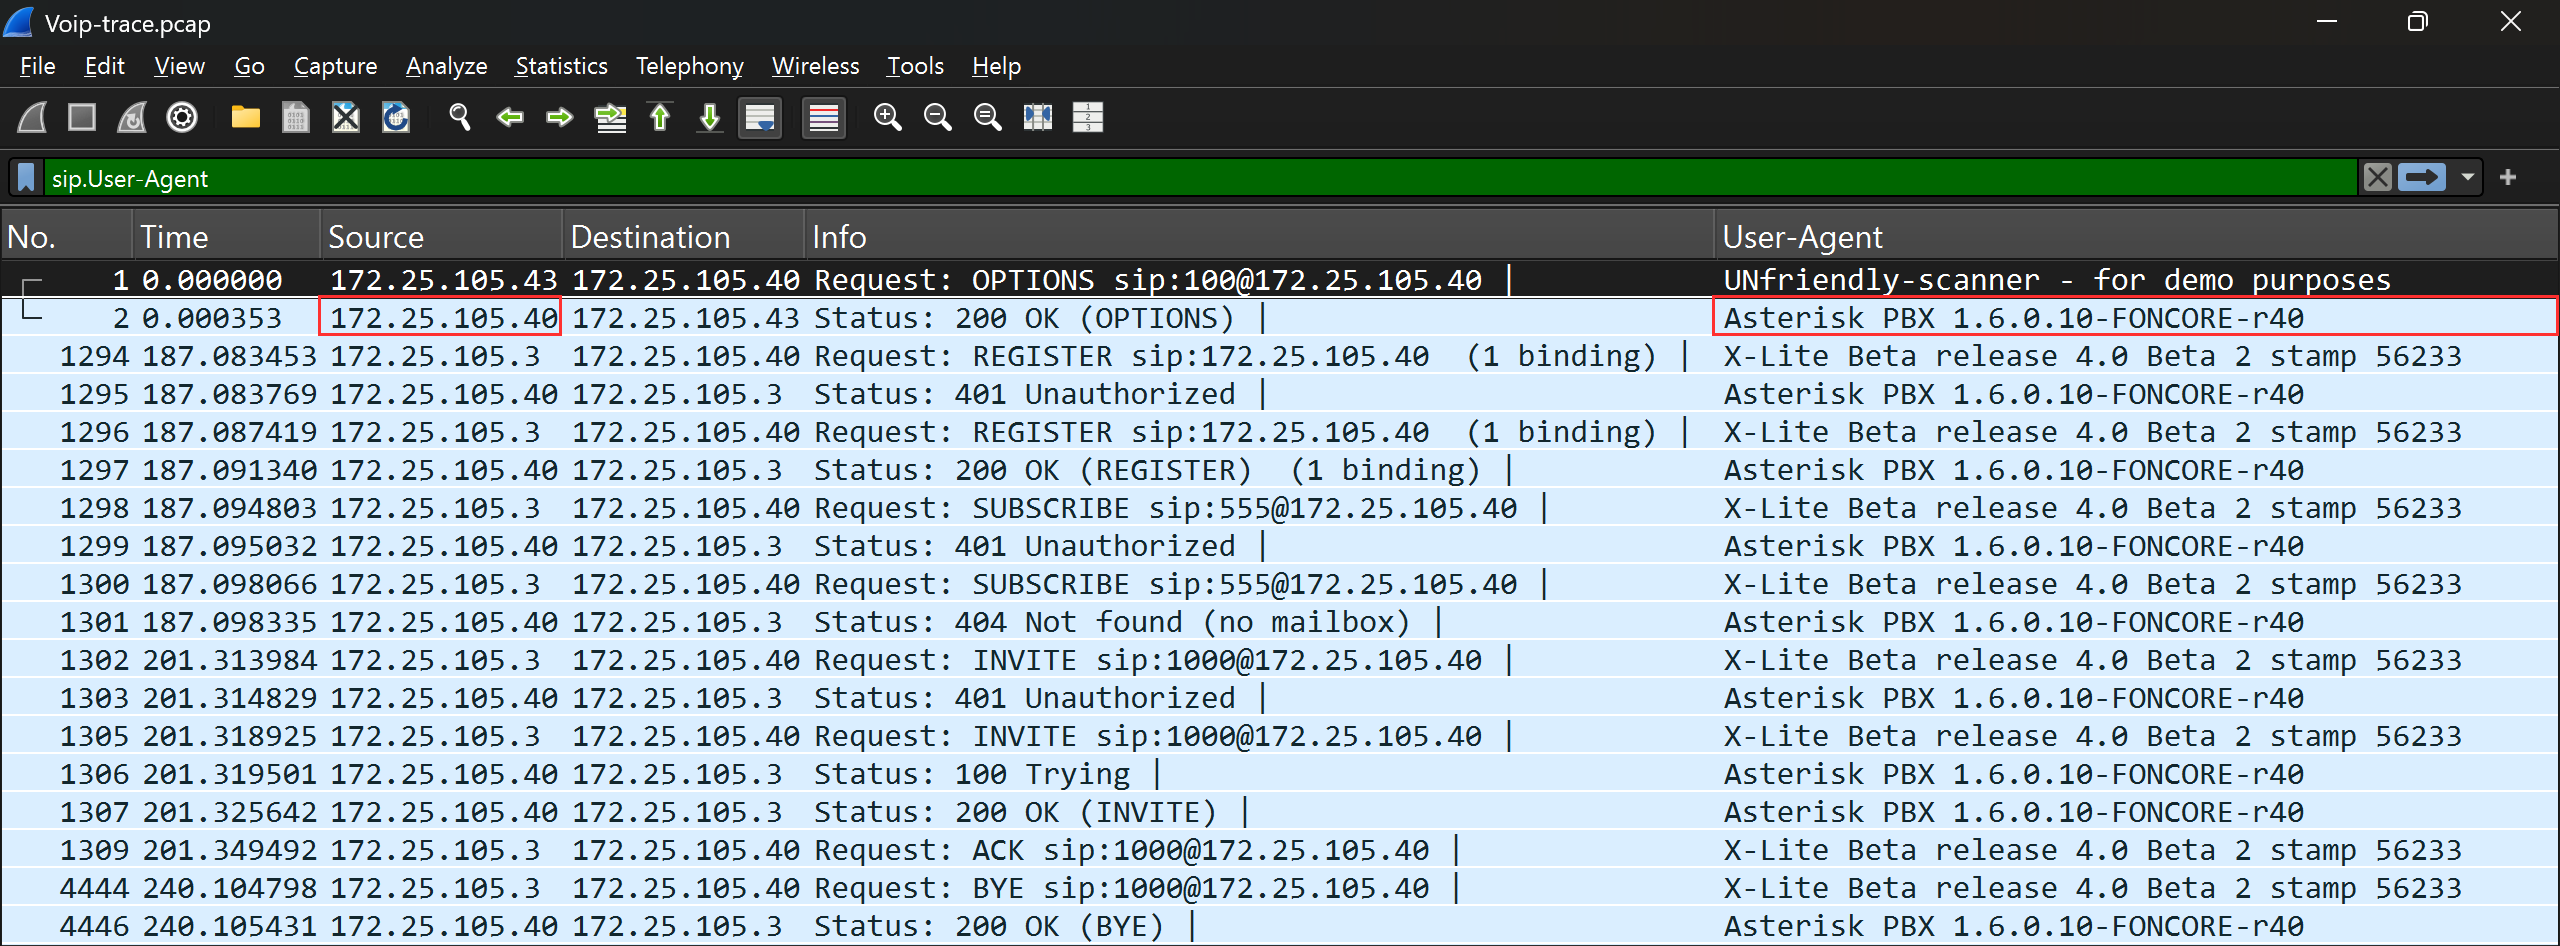
Now sort the rows by direction. The victim is the PBX, so look at the Source column and pick the rows where the server is the sender, which are the responses (
200 OK,401 Unauthorized,100 Trying). The boxed row below is the server answering the scanner's very first probe.
- Open that response and expand Session Initiation Protocol > Message Header to read the header in place, together with the
Allowlist that tells you it really is a PBX.
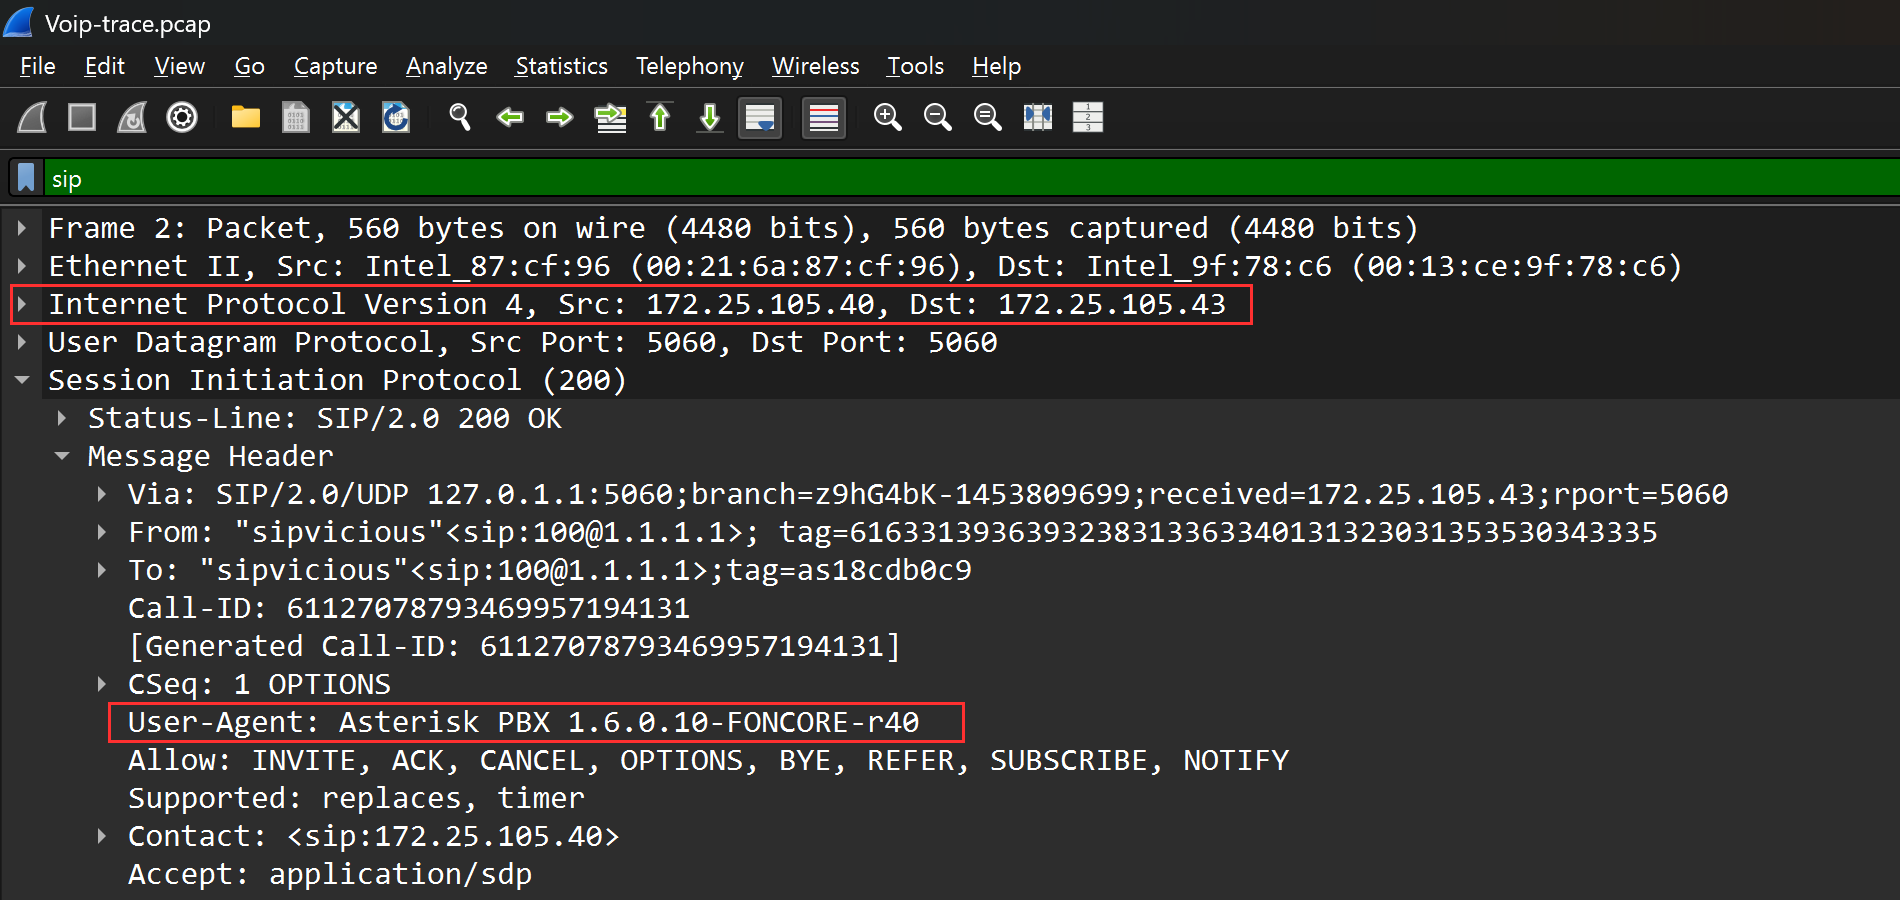
- Submit the value exactly as printed, including the version string and the build suffix, and without the
User-Agent:label in front of it.
Q4: Which tool was only used against the following extensions: 100,101,102,103, and 111?
What do we need to know?
The suite you named in Q2 is not one program, it is several, and each one leaves a differently shaped request on the wire. You do not need to read the source code to tell them apart; you can fingerprint them from the log itself:
| Shape of the request in the log | What the tool is doing |
|---|---|
A single OPTIONS to one extension |
mapping: is there a SIP service here at all |
REGISTER sip:<extension>@<domain> , the extension is in the request URI |
enumerating: which extension numbers exist |
REGISTER sip:<domain> , the extension is in the To: header, and a retry follows carrying Authorization: Digest |
cracking: guessing the password of a known extension |
That third shape is the one the question is asking about. It is the only one that ever carries an Authorization header, because guessing a password means answering the server's authentication challenge over and over.
The tool names in the suite are all short and begin with sv. Once you have matched the behaviour to the row above, the file name follows directly, and the answer format tells you it ends in .py.
How to do that?
-
Count the two
REGISTERshapes separately, then count the authorization attempts. The numbers immediately show that the enumeration sweep is huge, the second sweep is far smaller, and only a hundred-ish messages ever answer a challenge:grep -cE '^REGISTER sip:[^@]+@honey\.pot\.IP\.removed SIP/2\.0$' log.txt grep -c '^REGISTER sip:honey.pot.IP.removed SIP/2.0$' log.txt grep -c '^Authorization: Digest' log.txt

-
Pull the target extension out of the
To:header of the second shape and deduplicate it. This is the decisive step: the list that comes back is exactly the five extensions named in the question, which confirms you have isolated the right tool.grep -A6 '^REGISTER sip:honey.pot.IP.removed SIP/2.0$' log.txt \ | grep '^To:' | grep -oE 'sip:[0-9]+@' | sort -u

-
Read one complete message from that tool to see the mechanism. Note the
CSeqcounter has advanced to 2, meaning this is a retry, and that the retry carries a digest response for a named user:grep -B11 -m1 '^Authorization: Digest' log.txt
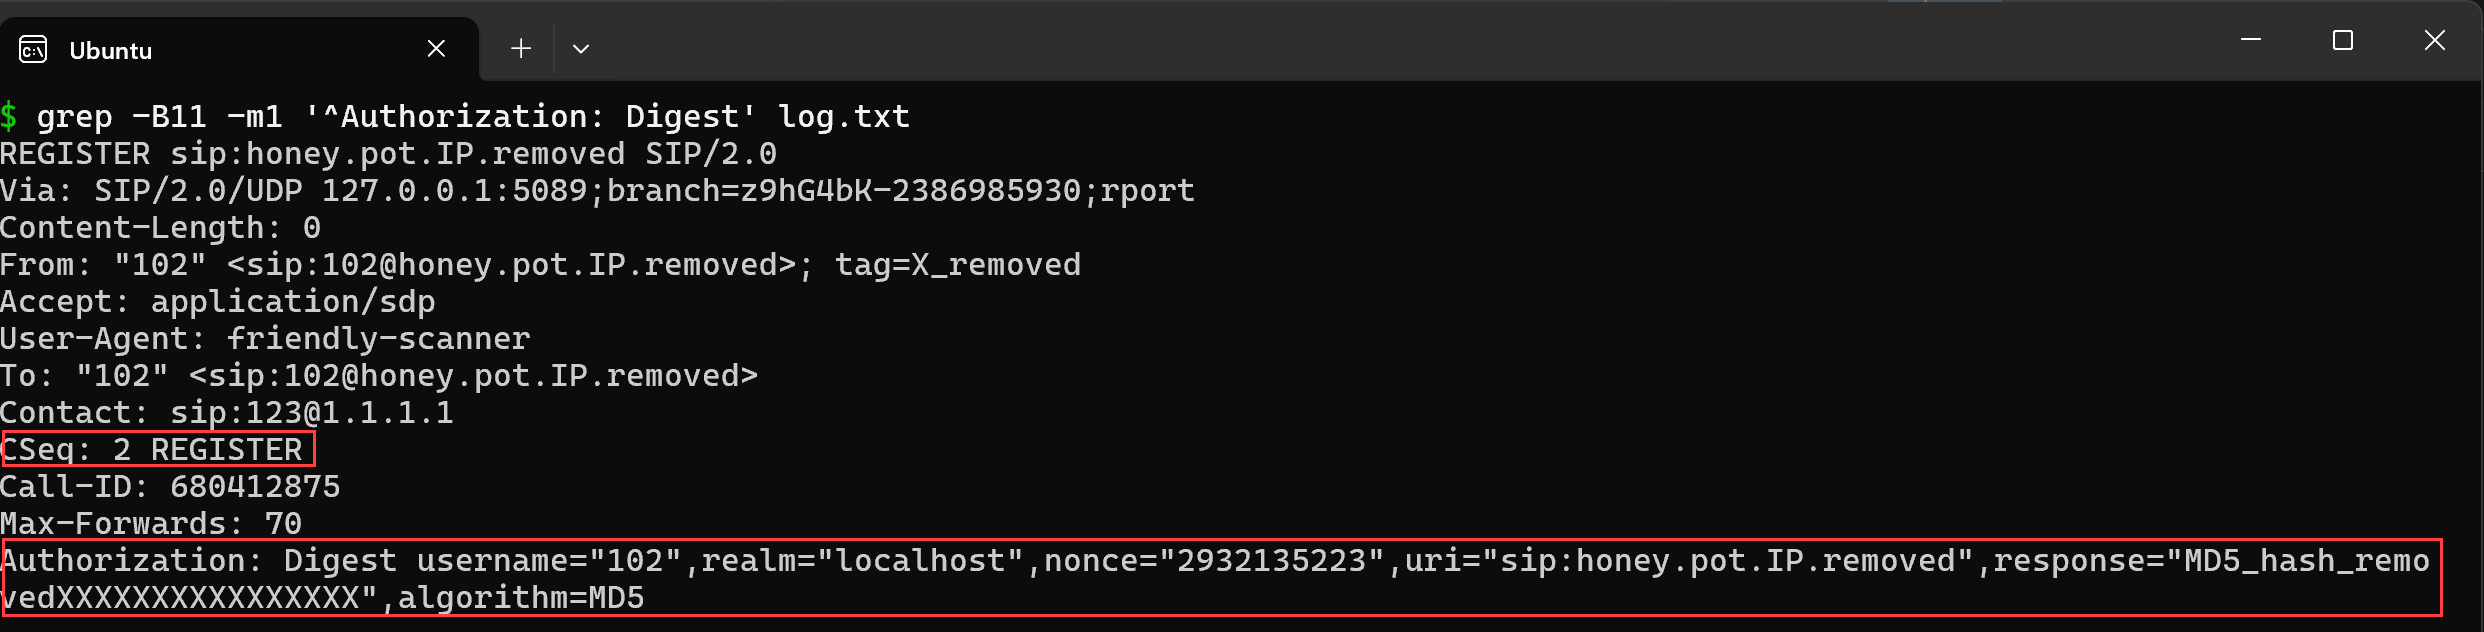
- Match that behaviour to the table above and submit the tool's file name.
Q5: Which extension on the honeypot does NOT require authentication?
What do we need to know?
SIP digest authentication is a challenge and response. The client sends a request, the server replies 401 Unauthorized with a fresh nonce, and the client sends the request again with an Authorization: Digest header proving it knows the password. If a server accepts a registration without challenging it, that second message never happens.
Here is the constraint that shapes the whole question: log.txt contains requests only. There are no 401 responses in the file to look at. So you cannot see the challenge directly. What you can see is its consequence: for every extension the server protects, the attacker's tool was forced to send a digest response, and for an extension the server does not protect, it never had to.
So the extension you are looking for is the one that was probed like all the others but never produced a single Authorization header.
How to do that?
-
Tally the user names inside every digest response in the file:
grep -oE 'Digest username="[0-9]+"' log.txt | sort | uniq -cCompare that list against the five extensions you identified in Q4. Four of the five are present. The one that is missing from this output is the one that never had to authenticate.

-
Make sure the absence means something. An extension could be missing from that tally simply because nobody ever attacked it, so put both numbers side by side for all five targets: how many times each was probed, and how many digest responses each produced.
for e in 100 101 102 103 111; do
  printf '%-6s probed=%-6s digests=%s\n' "$e" \
    "$(grep -c "To:.*sip:$e@honey" log.txt)" \
    "$(grep -A6 "To:.*sip:$e@honey" log.txt | grep -c Authorization)"
done
Every one of the five was probed. Only one of them answered zero challenges, and that combination, probed but never challenged, is what "does not require authentication" looks like in a request-only log.

- Submit the three-digit extension number on its own.
101is the most common wrong submission by a wide margin, and555is next.101appears constantly in both artifacts, and555is an account you will meet in Q12, but both of them do require authentication.
Q6: How many extensions were scanned in total?
What do we need to know?
Three numbers in this file look like plausible answers and only one of them is:
- The number of messages in the log is much larger, because the tools retried extensions many times over.
- The number of unique values in every
To:header is slightly too large, because that set also picks up the real phone numbers that were dialled later in the capture and the bogus1.1.1.1target the scanner put in its own first probe. - The number of unique extensions actually swept is the answer.
The clean way to isolate the sweep is to count the enumeration shape you identified in Q4, the one where the extension appears in the request URI. That shape exists precisely because the tool was walking a list of candidate extension numbers, one per request, so deduplicating those request lines counts the list.
How to do that?
-
Extract the enumeration request lines, deduplicate, and count. Because the lines differ only by the extension,
sort -ucollapses them to one line per distinct extension:grep -oE '^REGISTER sip:[^@]+@honey\.pot\.IP\.removed SIP/2\.0$' log.txt | sort -u | wc -l

-
Compute the two near-miss numbers as well, so you can see where they come from and be confident you submitted the right one. The first is every message in the file, the second is every distinct
To:user across the whole log:grep -c '^Datetime:' log.txt grep -h '^To:' log.txt | grep -oE 'sip:[^@]+@' | sort -u | wc -l

- Submit the number from step 1.
If you get a number three higher than the one in step 1, you have counted
To:headers across the whole file and swept up the dialled phone numbers from Q8 along with the extensions. If you get one four-digit number in the four thousands, you have counted messages rather than distinct extensions.
Q7: There is a trace for a real SIP client. What is the corresponding user-agent? (two words, once space in between)
What do we need to know?
Q2 established that only two User-Agent values exist in the honeypot log. One of them belongs to the scanner. By elimination the other belongs to a genuine softphone, and the question is asking for that one.
Two things corroborate that it is real rather than another tool. It arrives from a completely different source address than the scanner, and its messages are shaped like a phone doing ordinary work: a SUBSCRIBE for message-waiting notifications, a REGISTER, and later some real calls, all with a properly formed Via and a Contact pointing back at its own address and port, rather than the loopback address the scanner uses.
The answer format says two words with one space. The product name is one word and its revision is the other, so the space sits between them and nowhere else.
How to do that?
-
List the distinct agents, then list the distinct source addresses, and note that there are two of each:
grep -h '^User-Agent:' log.txt | sort -u
grep -h '^Source:' log.txt | cut -d' ' -f2 | cut -d: -f1 | sort -u

-
Read one full message from the non-scanner address to confirm it behaves like a phone rather than a tool:
grep -A16 -m1 '^Source: 89.42.194' log.txt
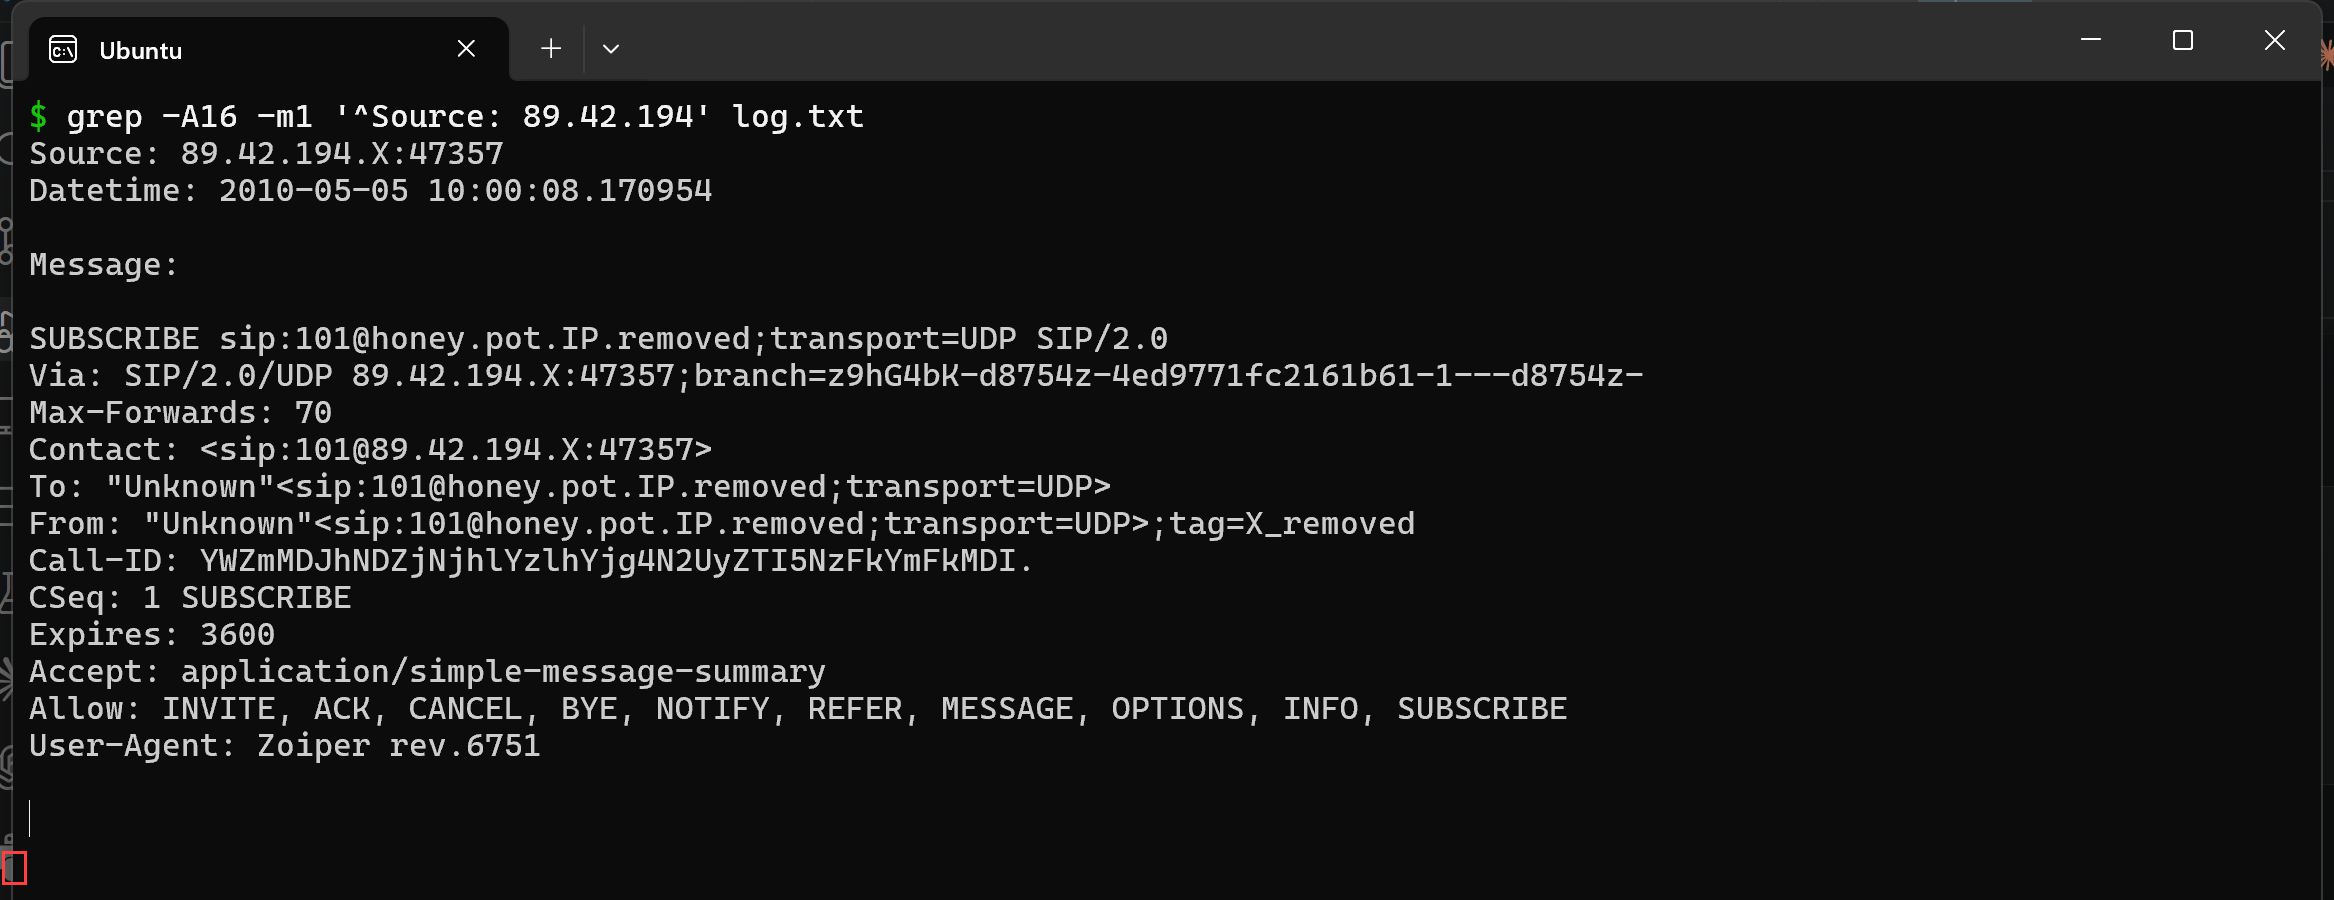
- Submit the agent string from that block, keeping the single space and the
rev.prefix on the revision number exactly as printed.
Do not answer this one from the pcap. The lab network in
Voip-trace.pcaphas its own softphone, and its name is a popular wrong submission here. This question is about the honeypot log.
Q8: Multiple real-world phone numbers were dialed. What was the most recent 11-digit number dialed from extension 101?
What do we need to know?
Once an attacker owns a SIP account they use it to place calls, usually to premium-rate or international numbers they profit from. That is toll fraud, and the INVITE requests are the record of it.
The question stacks three filters, and each one eliminates a specific wrong answer:
- from extension 101. The calling account is in the
Fromheader, not the request URI. There are fourINVITEs in the log and they do not all come from the same extension. - 11-digit. The dialled numbers have had their trailing digits masked with
X, so count only the digits before the mask. One of the numbers dialled from 101 is twelve digits long and is therefore not the answer. - most recent. Of the numbers that survive both filters, take the one with the latest timestamp.
How to do that?
-
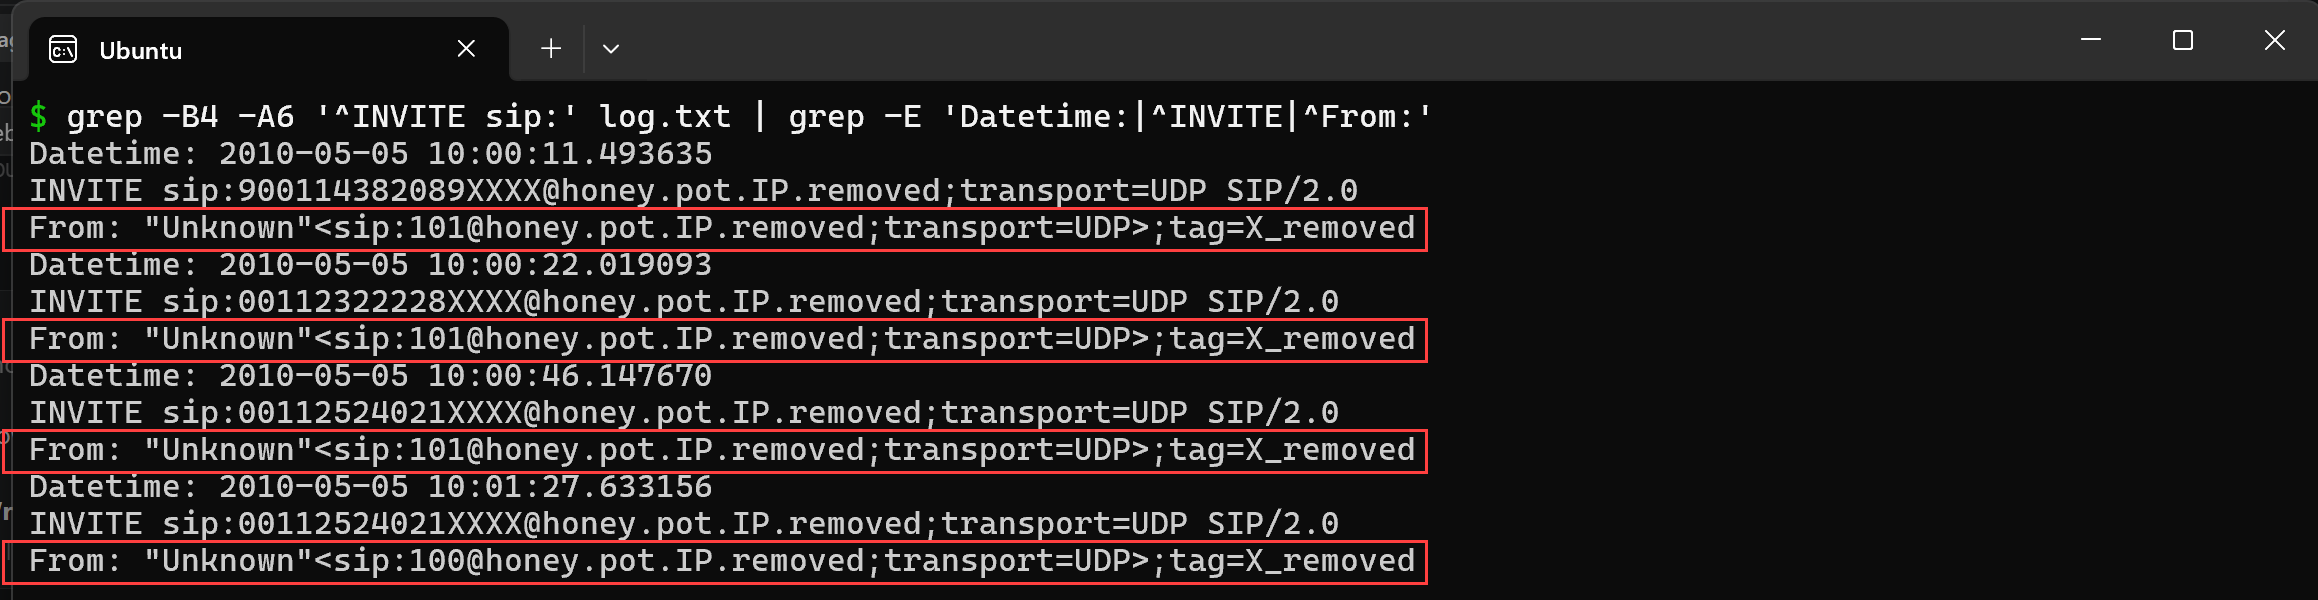
List every
INVITEin the log together with the timestamp above it and the calling party below it. The-B4reaches back to theDatetime:line and the-A6reaches forward to theFrom:header:grep -B4 -A6 '^INVITE sip:' log.txt | grep -E 'Datetime:|^INVITE|^From:'Four calls come back. Read the boxed
From:line under each one and discard the call that was not placed from the extension in the question.
-
Narrow to just the calls placed from that extension, which is exactly what the lab hint does:
grep -Ei 'From: "Unknown"<sip:101' log.txt -B8 | grep INVITEThree calls remain, listed oldest to newest.

-
Count the digits in each dialled number, ignoring the
Xmask characters. Drop the one that is too long, then take the later of the two that remain. -
Submit the digits only. Keep both leading zeros and do not include the
Xcharacters or the@honey.pot.IP.removedthat follows.
Dropping the two leading zeros is the single most common wrong submission on this question, and including the
XXXXmask is the next.
Q9: What are the default credentials used in the attempted basic authentication? (format is username:password)
What do we need to know?
We are back in the pcap now. Alongside the SIP scanning, the attacker browsed the PBX's web administration interface. That interface is protected with HTTP Basic authentication, which is not encryption of any kind: the client concatenates the user name and password with a colon, Base64-encodes the result, and puts it in an Authorization: Basic header. Base64 is an encoding, not a cipher, so anyone who can see the packet can read the password.
Wireshark knows this and decodes the header for you, so there is no need to run the string through a decoder yourself. The pair you will find is a well-known default for this PBX distribution's maintenance interface, which is what makes it worth flagging as a finding.
How to do that?
-
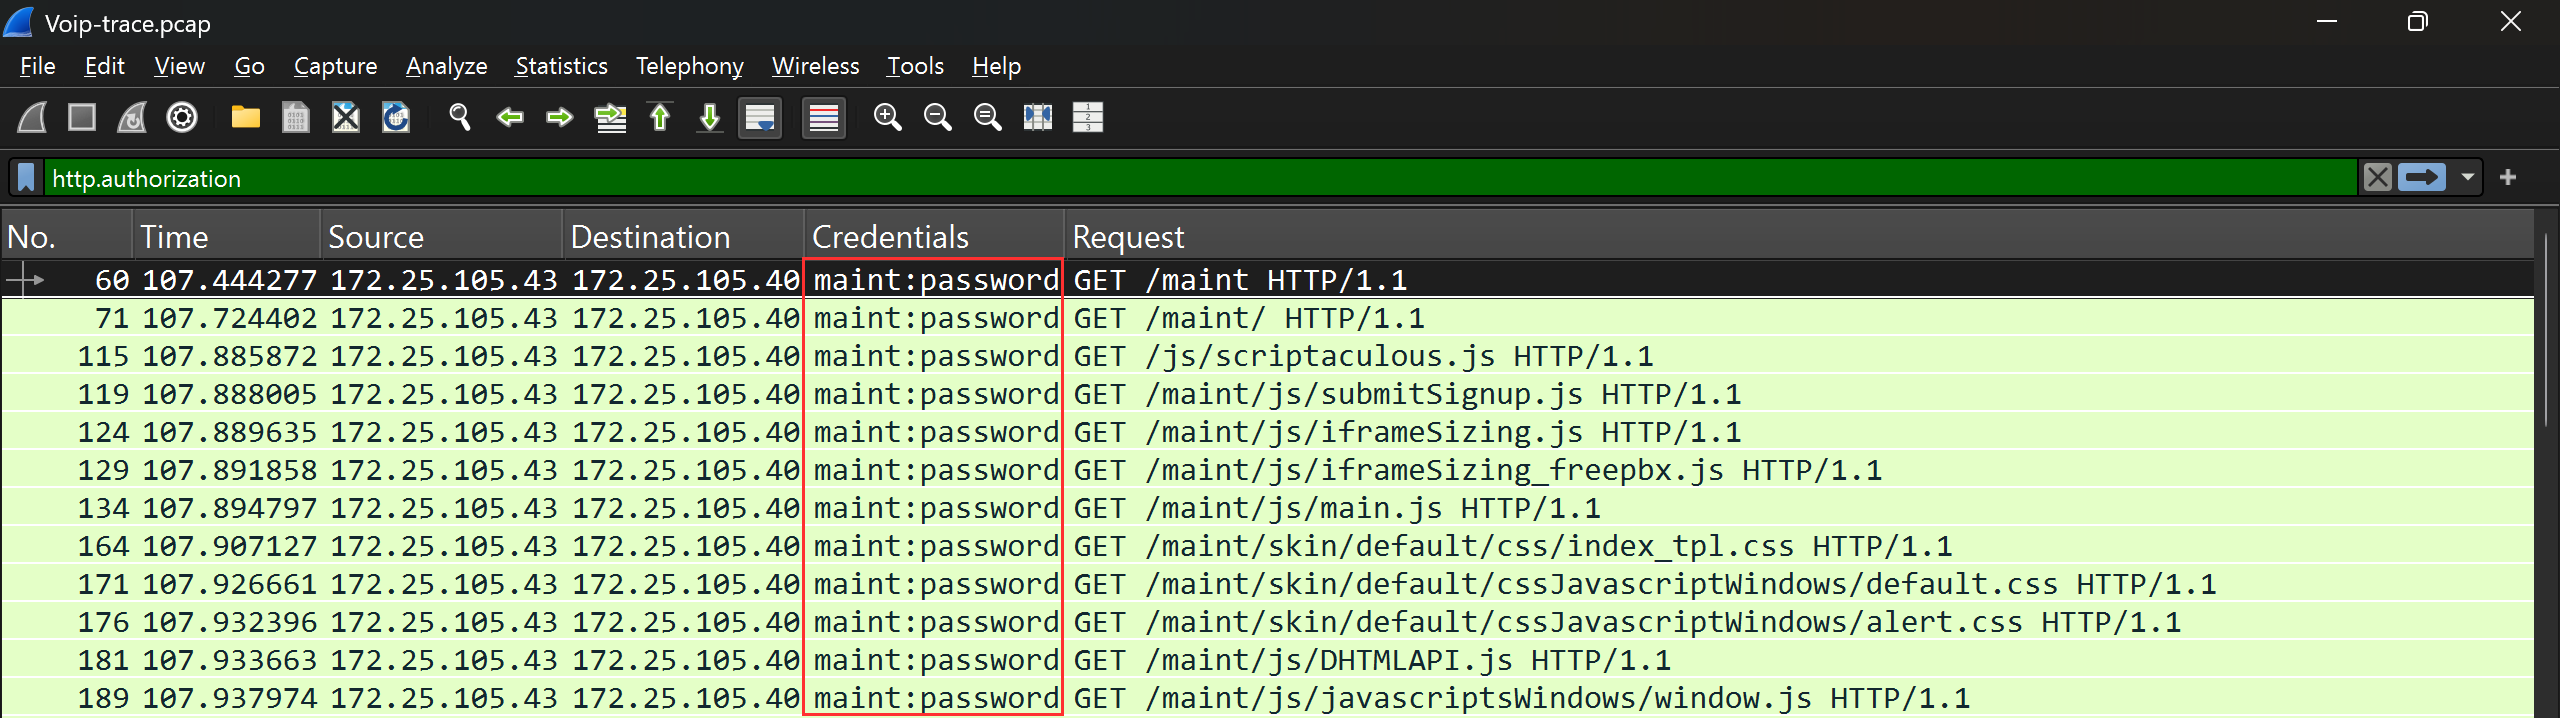
Filter for HTTP requests that carry the header, and add the decoded credentials as a column. Add a custom column for
http.authbasic, or right-click the Credentials field in the packet detail and choose Apply as Column:http.authorizationEvery subsequent request in the session reuses the same header, so the same value repeats down the whole column.
- Open the first of those requests and expand Hypertext Transfer Protocol > Authorization. Wireshark shows the raw Base64 on the header line and its decoded form on the child line beneath it.
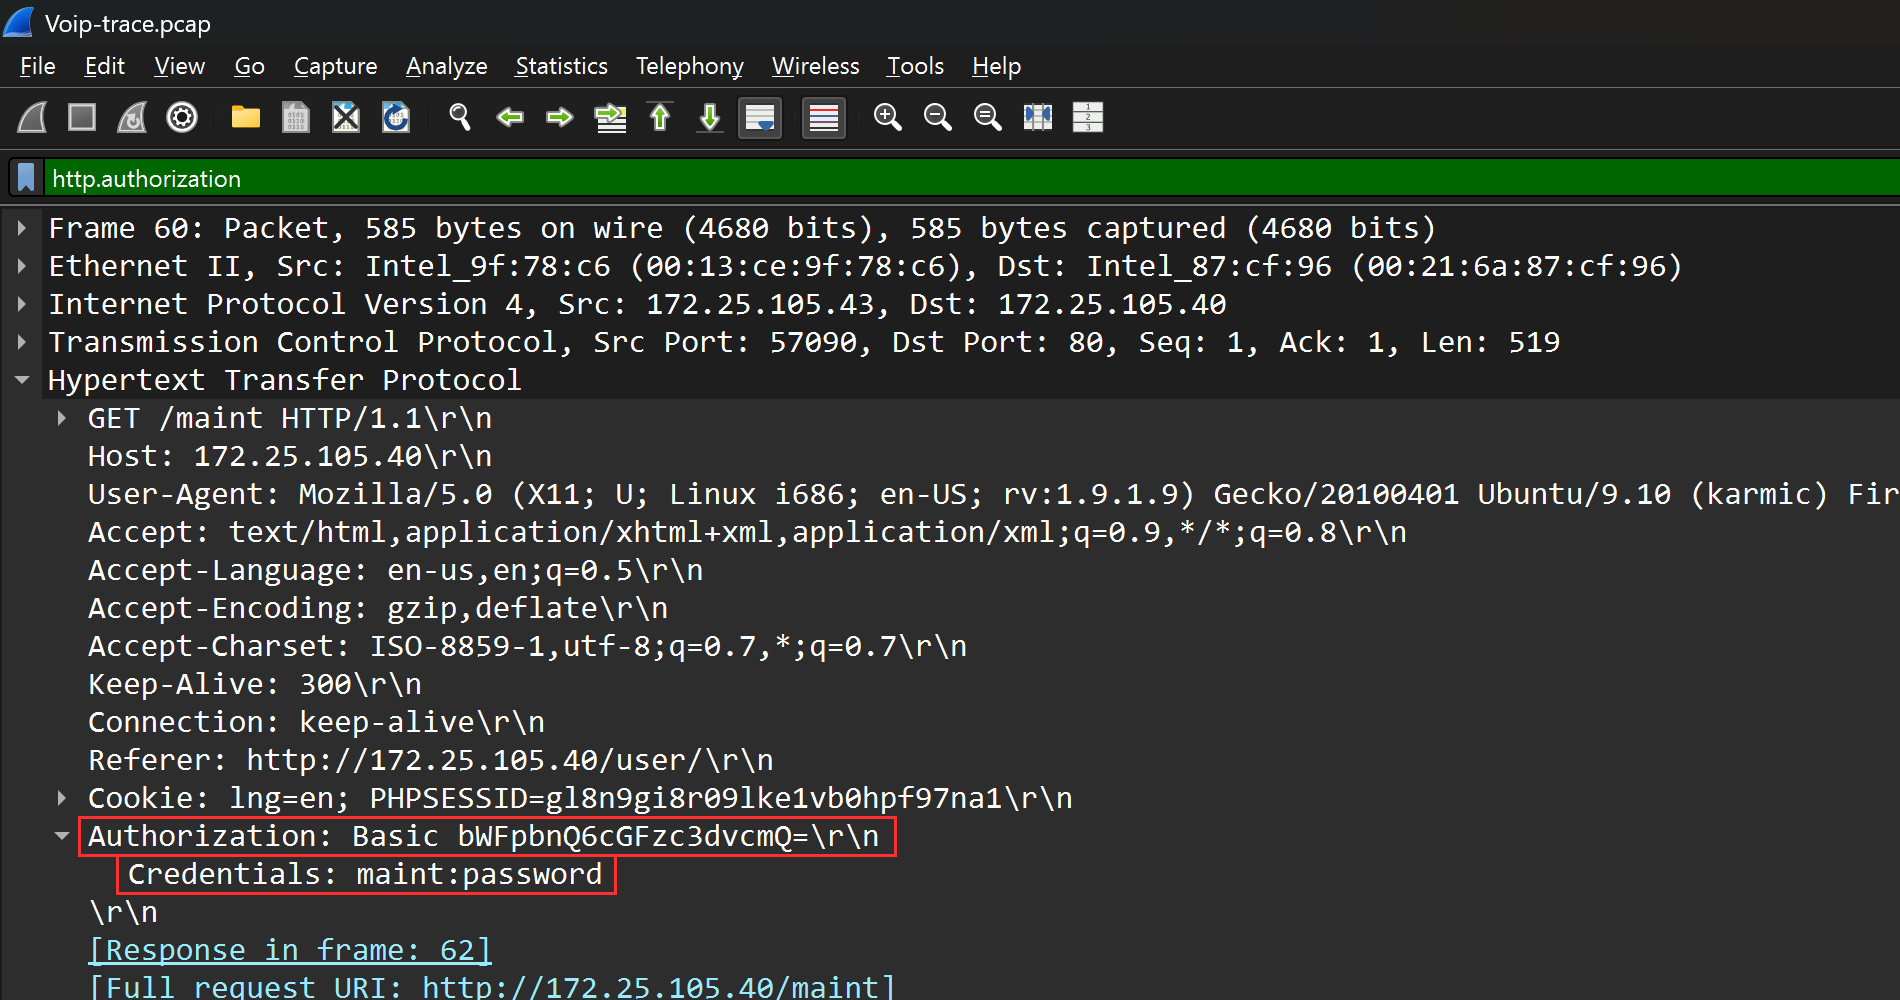
- Submit the decoded child line as
username:password, with the colon and no spaces.
Q10: Which codec does the RTP stream use? (3 words, 2 spaces in between)
What do we need to know?
Every RTP packet header carries a payload type, a small integer that says how the audio in that packet is encoded. The numbers are assigned by IANA, and the low ones are static: payload type 0 always means the same codec, everywhere, which is why an RTP dissector can name the codec without being told.
Wireshark prints that name for you in two places, and both are worth checking because they are formatted differently. The RTP Streams window abbreviates it. The packet detail spells it out in full and appends the numeric payload type in parentheses.
How to do that?
- Open Telephony > RTP > RTP Streams. Wireshark lists every RTP conversation it recognised, one row per direction, and the Payload column names the codec for each.

-
That column uses a short form. To get the full name, select any RTP packet and expand Real-Time Transport Protocol in the packet detail:
rtp
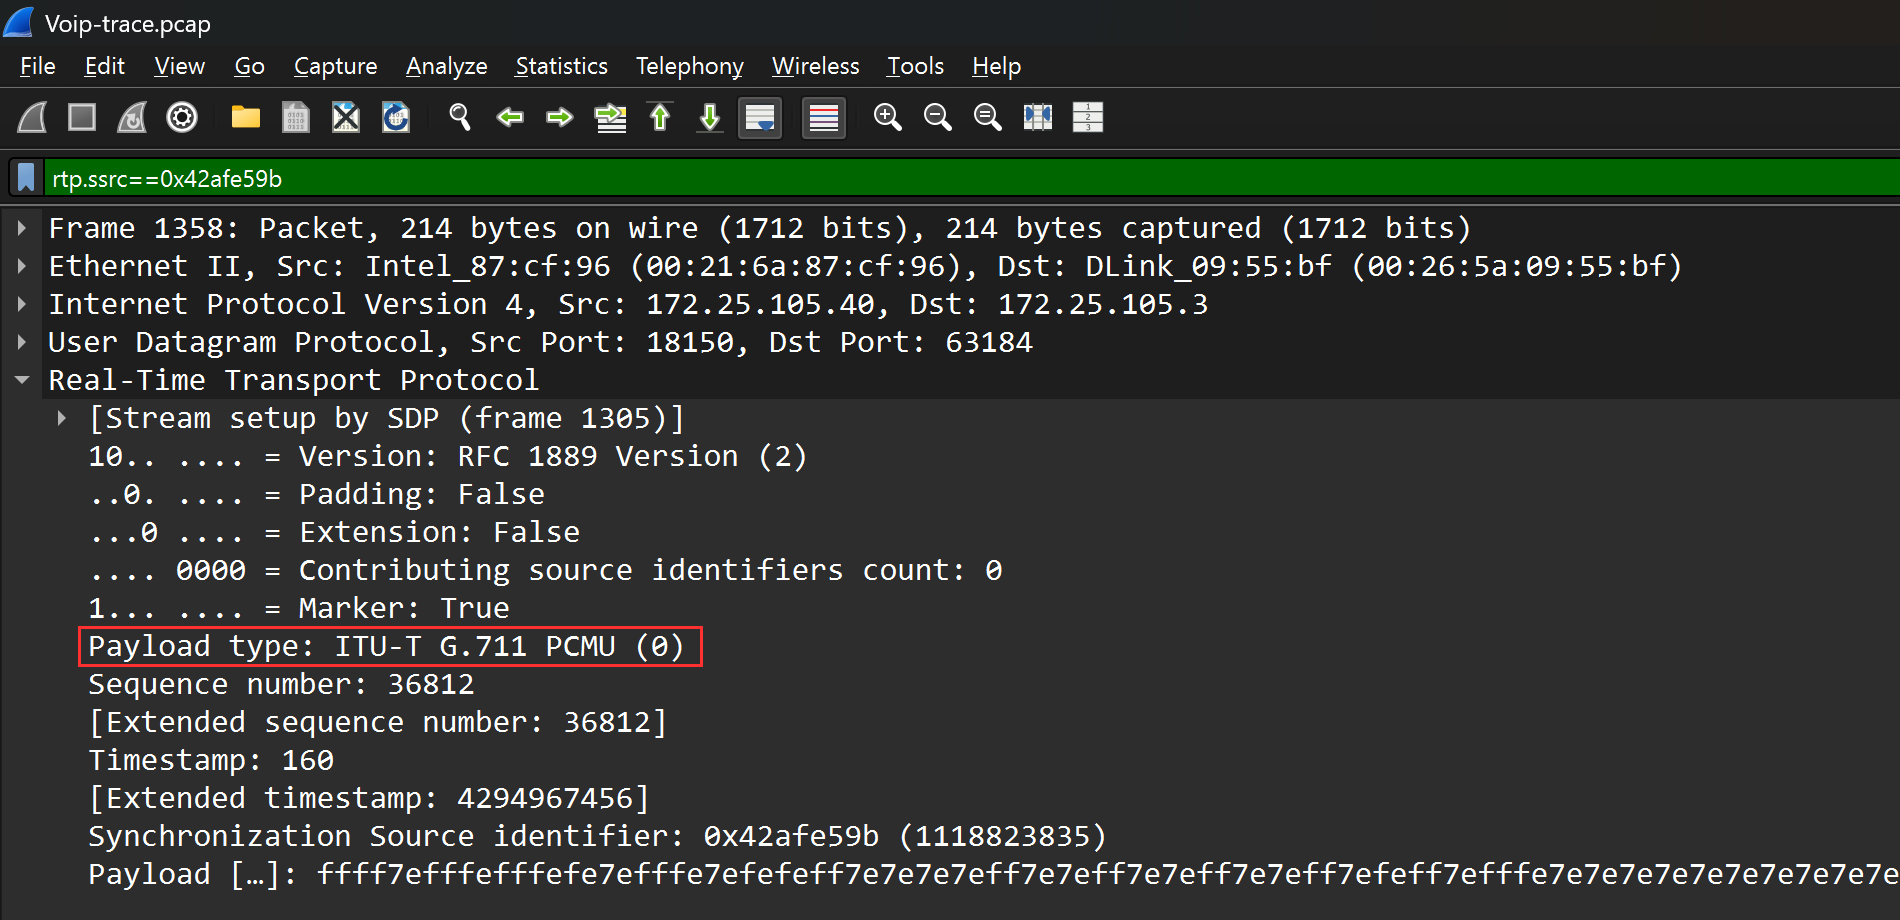
- Read the boxed field and submit the three words in front of the parentheses, keeping the hyphen inside the first word and the dot inside the second.
Q11: How long is the sampling time (in milliseconds)?
What do we need to know?
Sampling time is the interval between one audio sample and the next, and it is simply the reciprocal of the sampling frequency:
sampling time = 1 / sampling frequency
So the whole question reduces to finding the codec's clock rate, and this capture states it in two independent places.
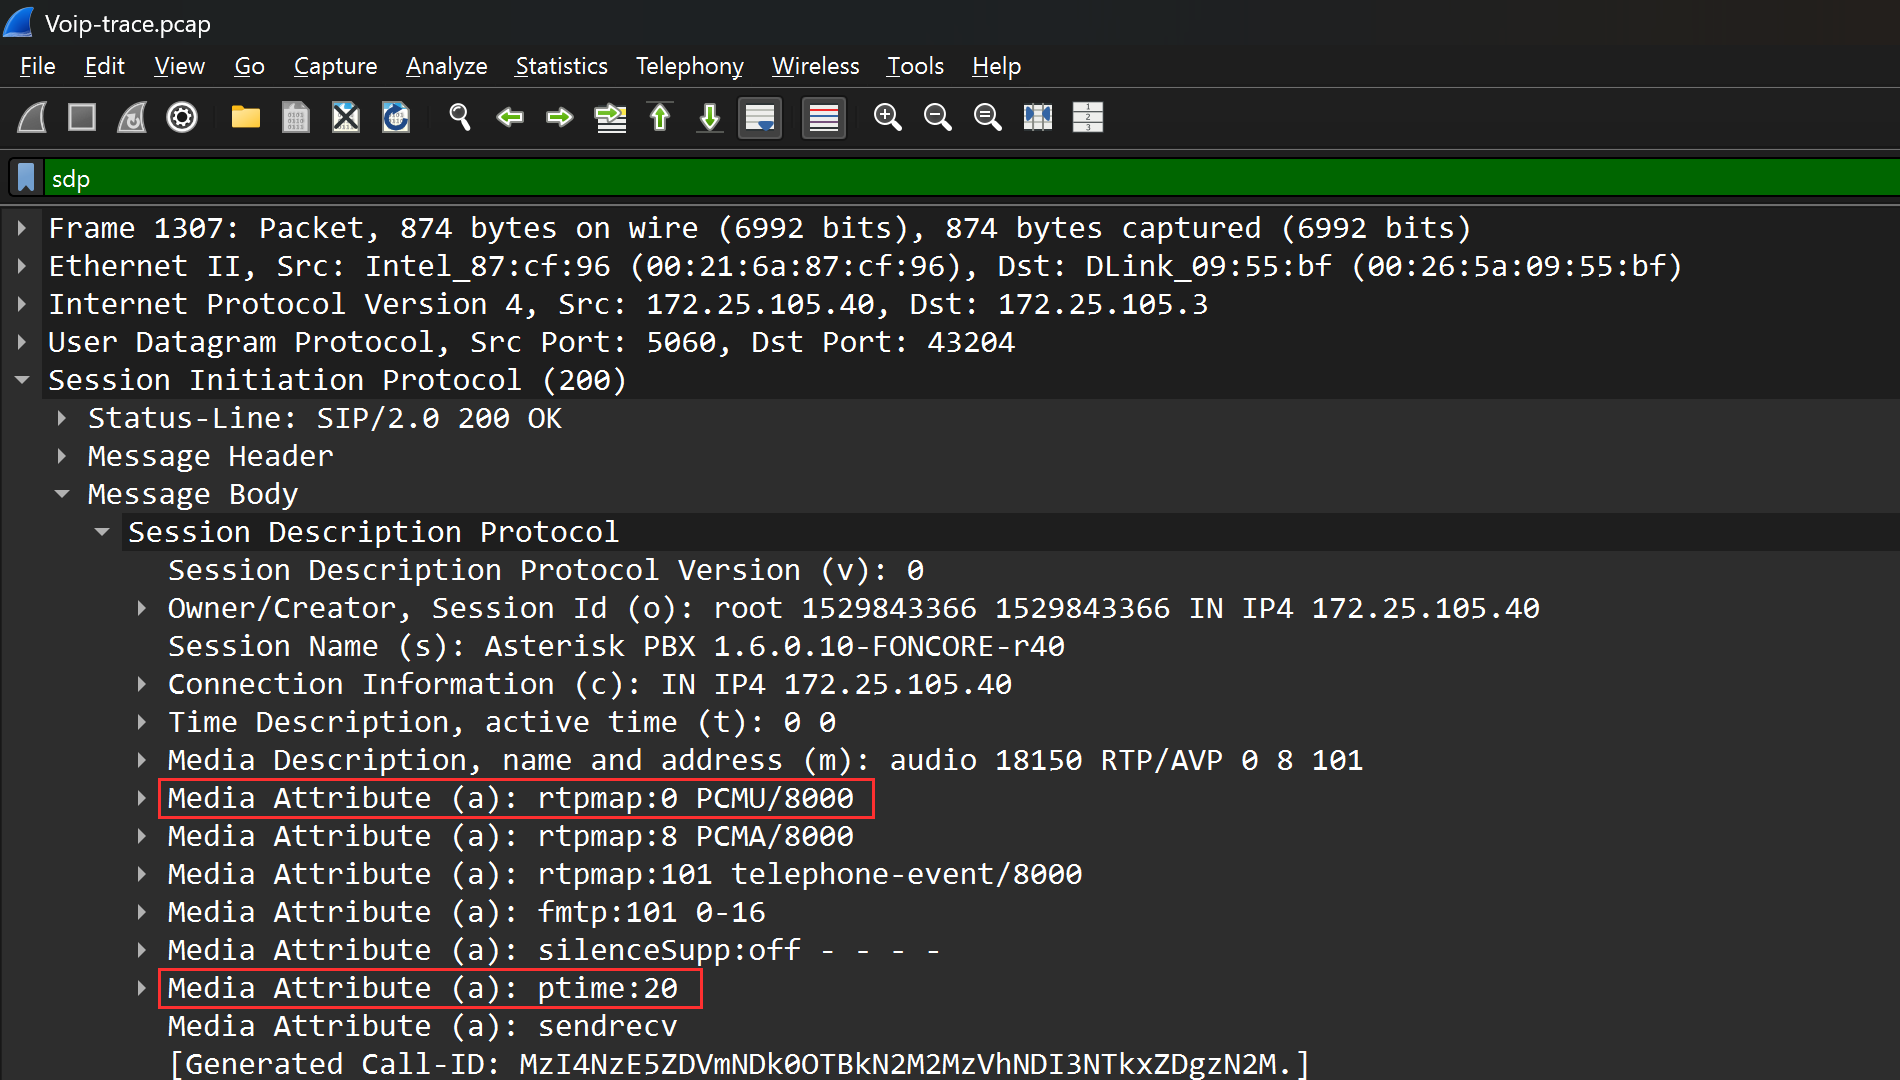
The first is the SDP that set the call up. When the two ends negotiated the media session they exchanged an a=rtpmap attribute for each codec they support, and the number after the slash in that attribute is the clock rate in hertz.
The second is the RTP timestamps themselves. The RTP timestamp counts samples, not milliseconds. If you know how many samples pass between two packets and how much real time passed between them, you have the clock rate directly. That cross-check is worth doing because it turns a looked-up constant into something you measured from the evidence.
Be careful not to confuse the sampling interval with the packetisation interval. Each packet here carries twenty milliseconds of audio, and
0.020is a common wrong submission. The question is asking about a single sample, which is far shorter.
How to do that?
-
Find the SDP offer that set up the media session and read the clock rate the two ends agreed on. Select the
200 OKthat carries SDP and expand Message Body > Session Description Protocol:sdpRead the
rtpmapattribute for the codec you identified in Q10. The number after the slash is the sampling frequency in hertz. Theptimeattribute lower down is the packetisation interval in milliseconds, which is the number you must not confuse it with.
-
Verify that frequency against the wire. Add
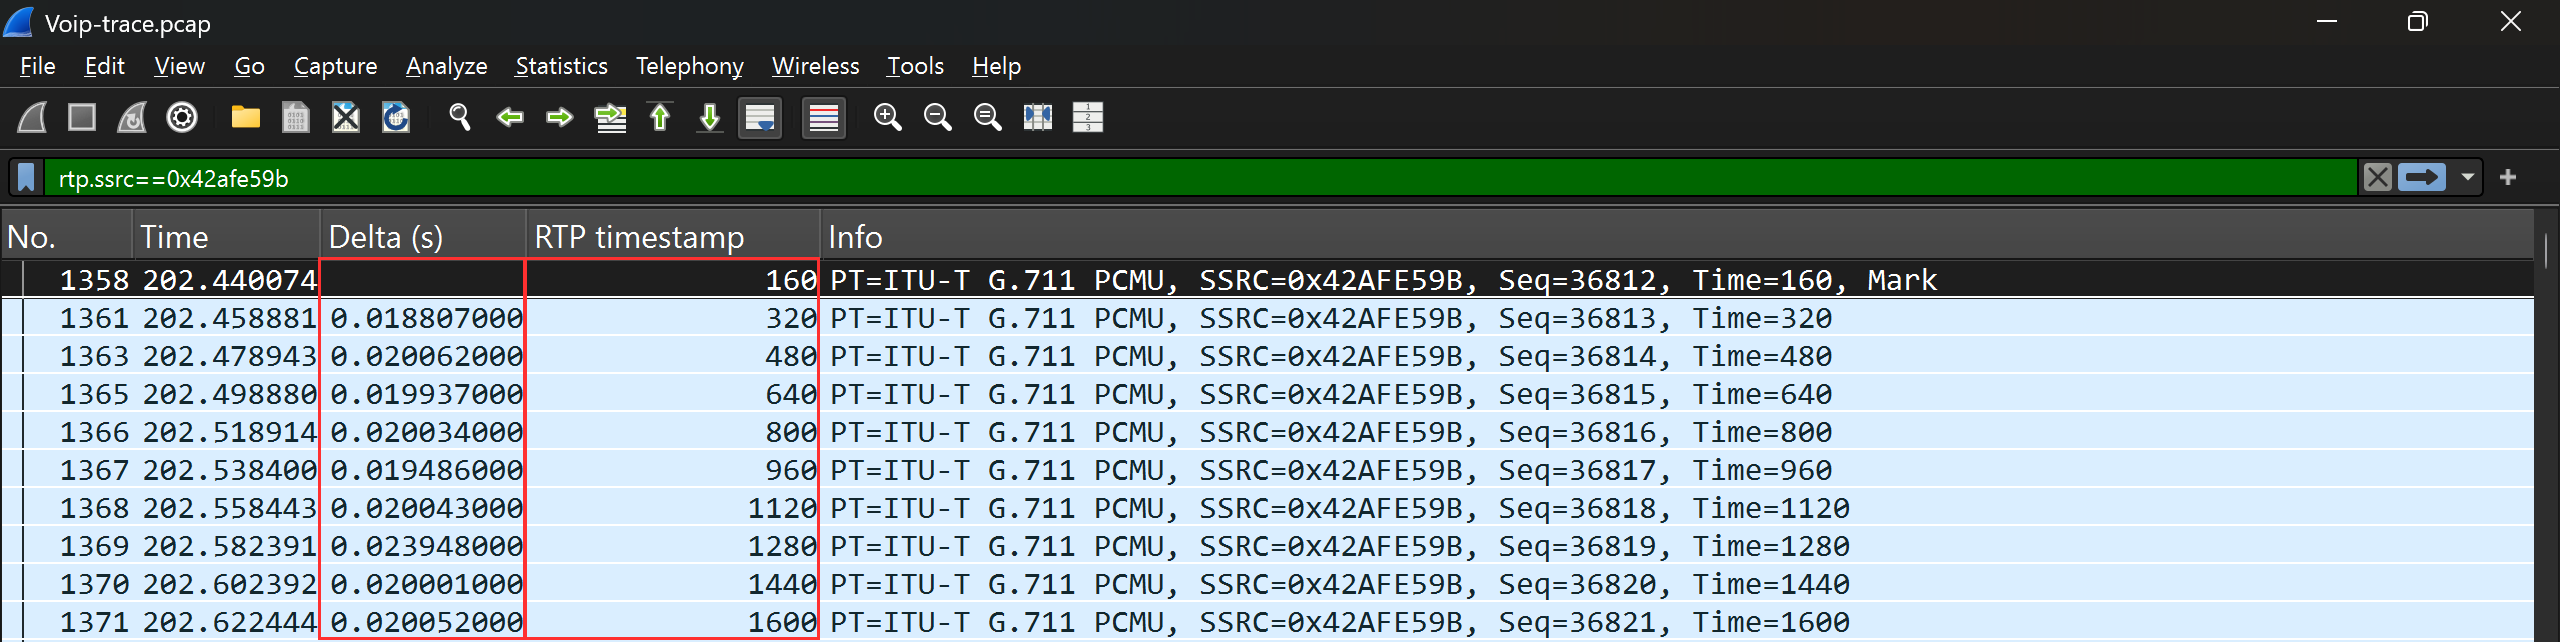
frame.time_delta_displayedandrtp.timestampas columns and watch them advance together:rtp.ssrc==0x42afe59bThe delta column shows the real time between consecutive packets, and the RTP timestamp column shows how far the sample counter moved in that time. Divide the timestamp step by the time step and you get the clock rate, matching what the SDP advertised.
-
Take the reciprocal of that frequency to get seconds per sample, then multiply by 1000 to convert to milliseconds.
-
Submit the number to three decimal places, with a dot as the decimal separator and no unit after it.
Q12: What was the password for the account with username 555?
What do we need to know?
The PBX's maintenance interface, the one the attacker logged into in Q9, includes a configuration file editor. That editor loads the raw text of a config file into an HTML textarea so it can be edited in the browser, which means the entire file content crosses the network in the clear inside an HTTP response body.
The file that matters here defines SIP accounts. In this configuration format each account is a stanza headed by the account name in square brackets, and the password sits on a line inside that stanza under a key that means "shared secret" rather than anything containing the word password. Searching the capture for the word password will not find it.
Note also that the same password value appears under more than one account stanza in this file, so make sure you read the value from inside the stanza that matches the user name in the question.
How to do that?
-
Find the exchange that transfers the file. Filtering on the file name catches both the request and the response that carries the content:
http contains "sip_custom.conf"

- Right-click either packet and choose Follow > HTTP Stream to reassemble the whole conversation as readable text. The response body is a full HTML page, so use the Find box at the bottom of the window to jump to the account stanza rather than scrolling.
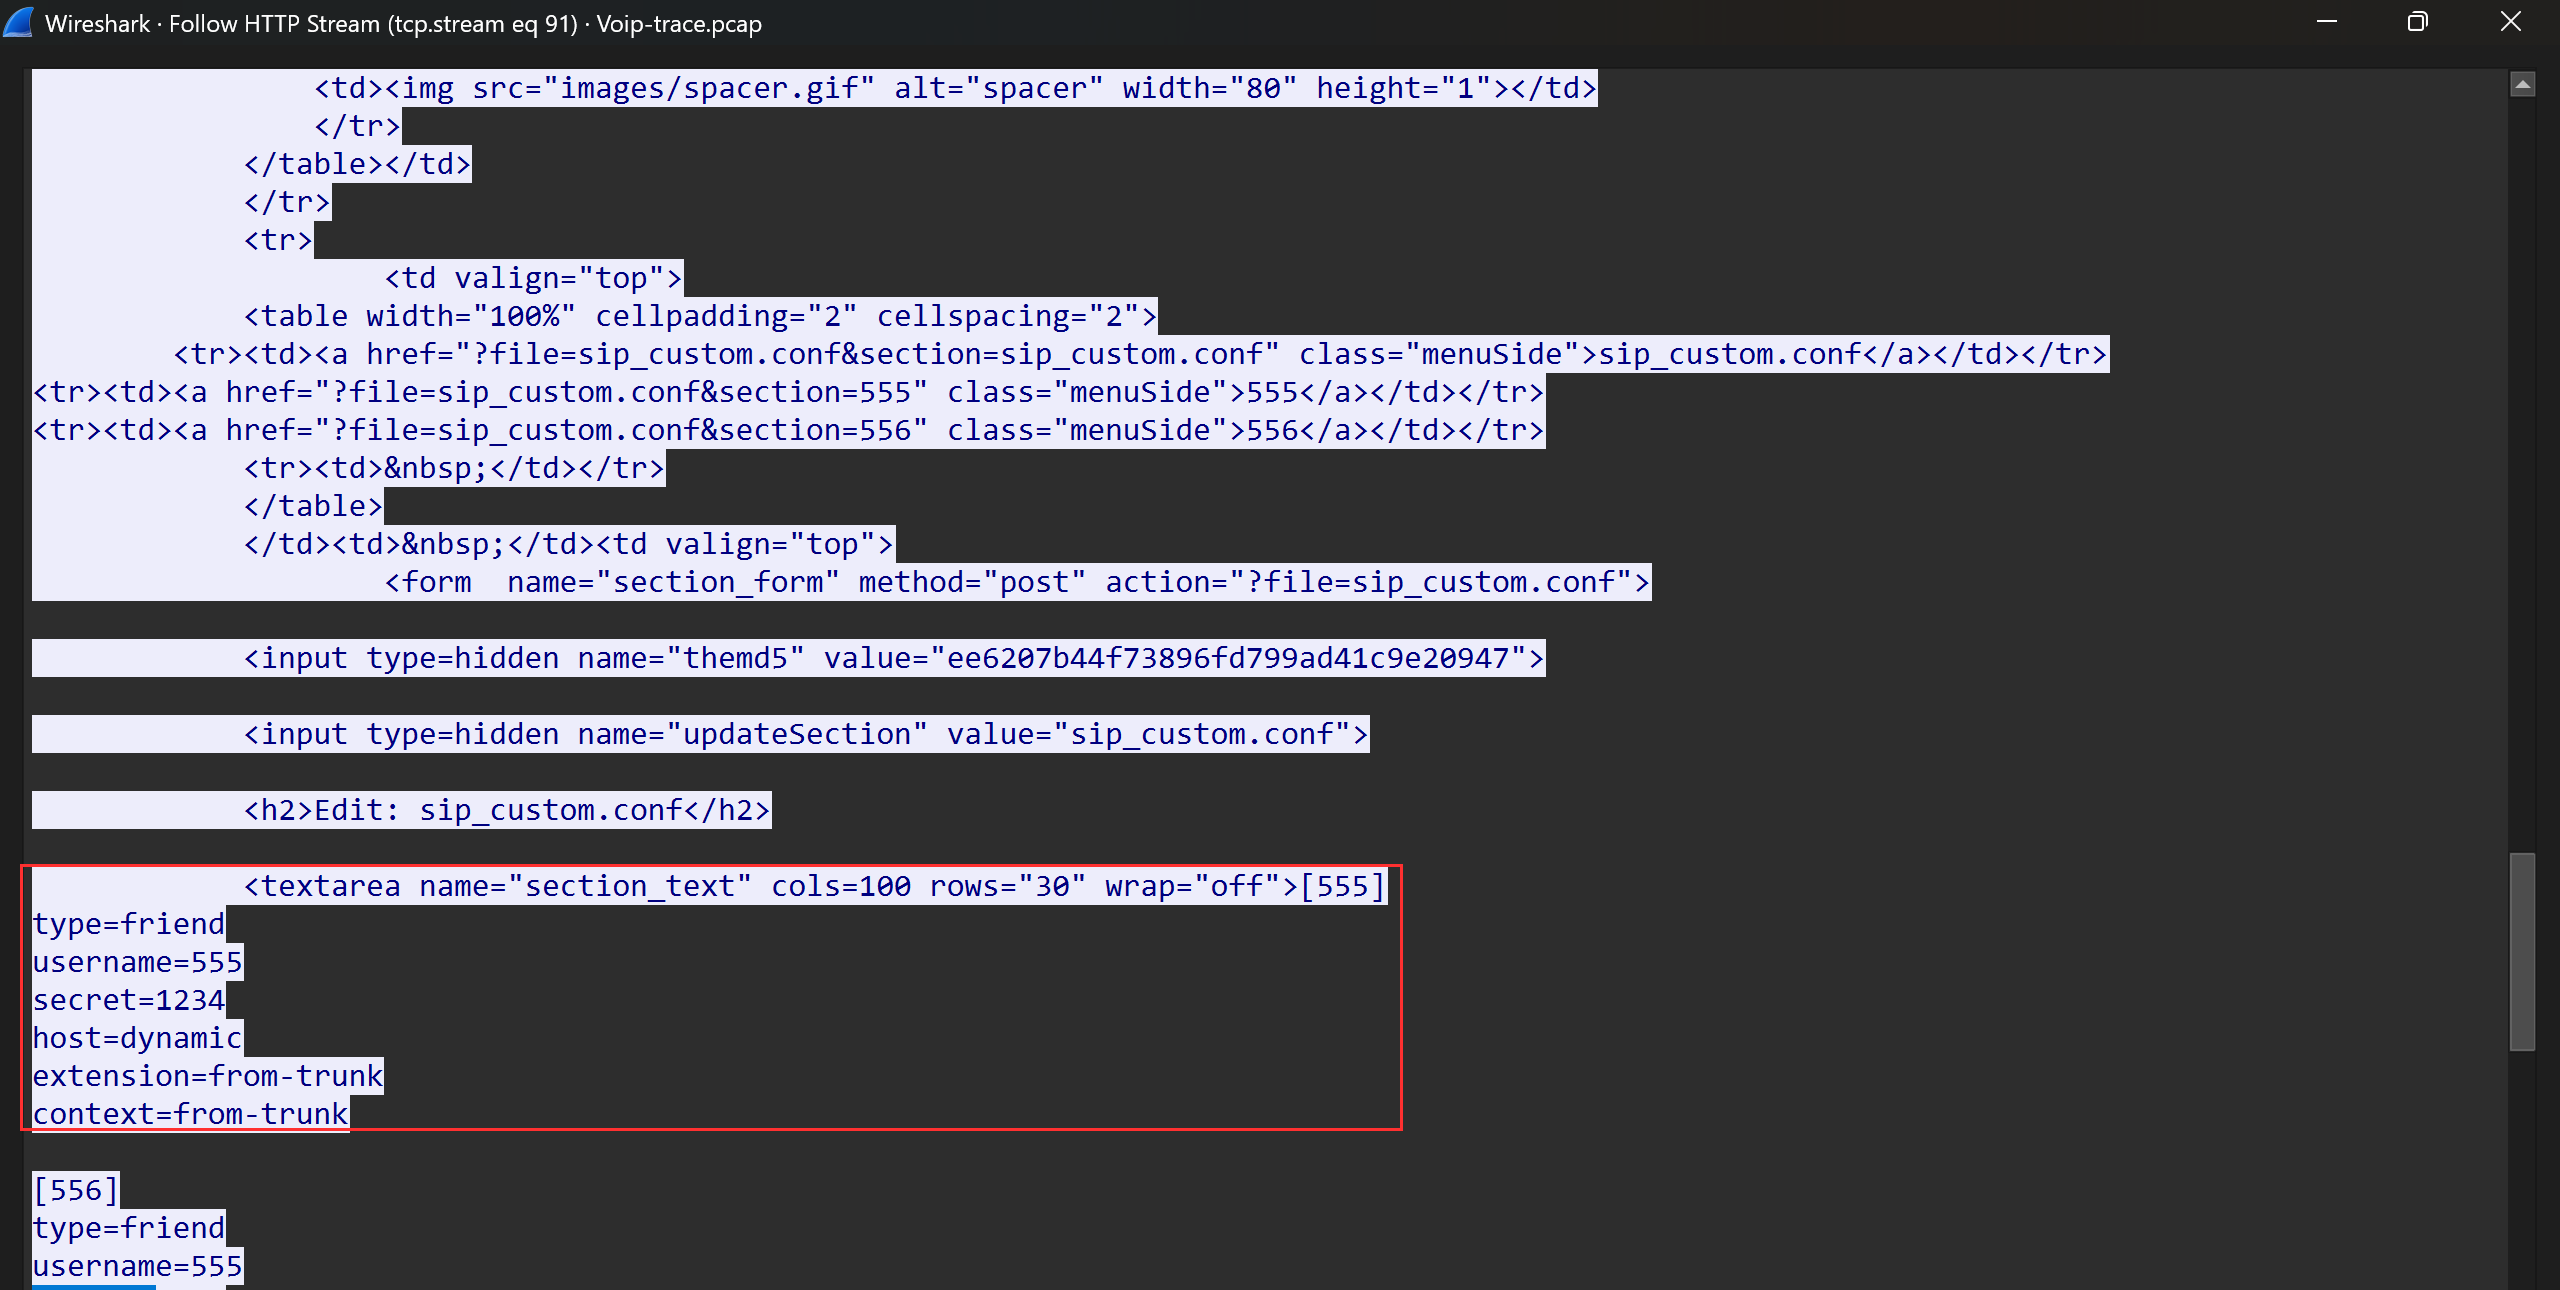
- Read the value on the secret line inside the boxed stanza whose heading matches the user name in the question, and submit those four digits on their own.
Q13: Which RTP packet header field can be used to reorder out of sync RTP packets in the correct sequence?
What do we need to know?
The RTP header carries two counters that both advance as a stream plays, and RFC 3550 gives each of them a different job.
The sequence number increments by exactly one for every packet sent. Section 5.1 says it "may be used by the receiver to detect packet loss and to restore packet sequence". Transmission order is what this field is for.
The other counter carries the sampling instant of the first octet of media in the packet, expressed in the codec's own sample clock. You measured that clock in Q11 and watched this field advance by a fixed block of samples per packet. It does not count packets at all. It states where the audio inside the packet belongs on the media timeline, which is what a receiver uses to schedule playout: to space samples correctly, to absorb jitter, and to reconstruct continuous audio from packets that arrived with uneven delay.
Read the stem carefully, because its wording is loose. Taken literally, restoring the order in which packets were transmitted is the sequence number's documented purpose. What this question is after is the field that reconstructs the correct playout timing of the media, the one carrying the sampling instant rather than the one counting packets. That distinction is the whole question, and the packet counter is by far the most common wrong submission here, in every capitalisation and in both singular and plural.
How to do that?
-
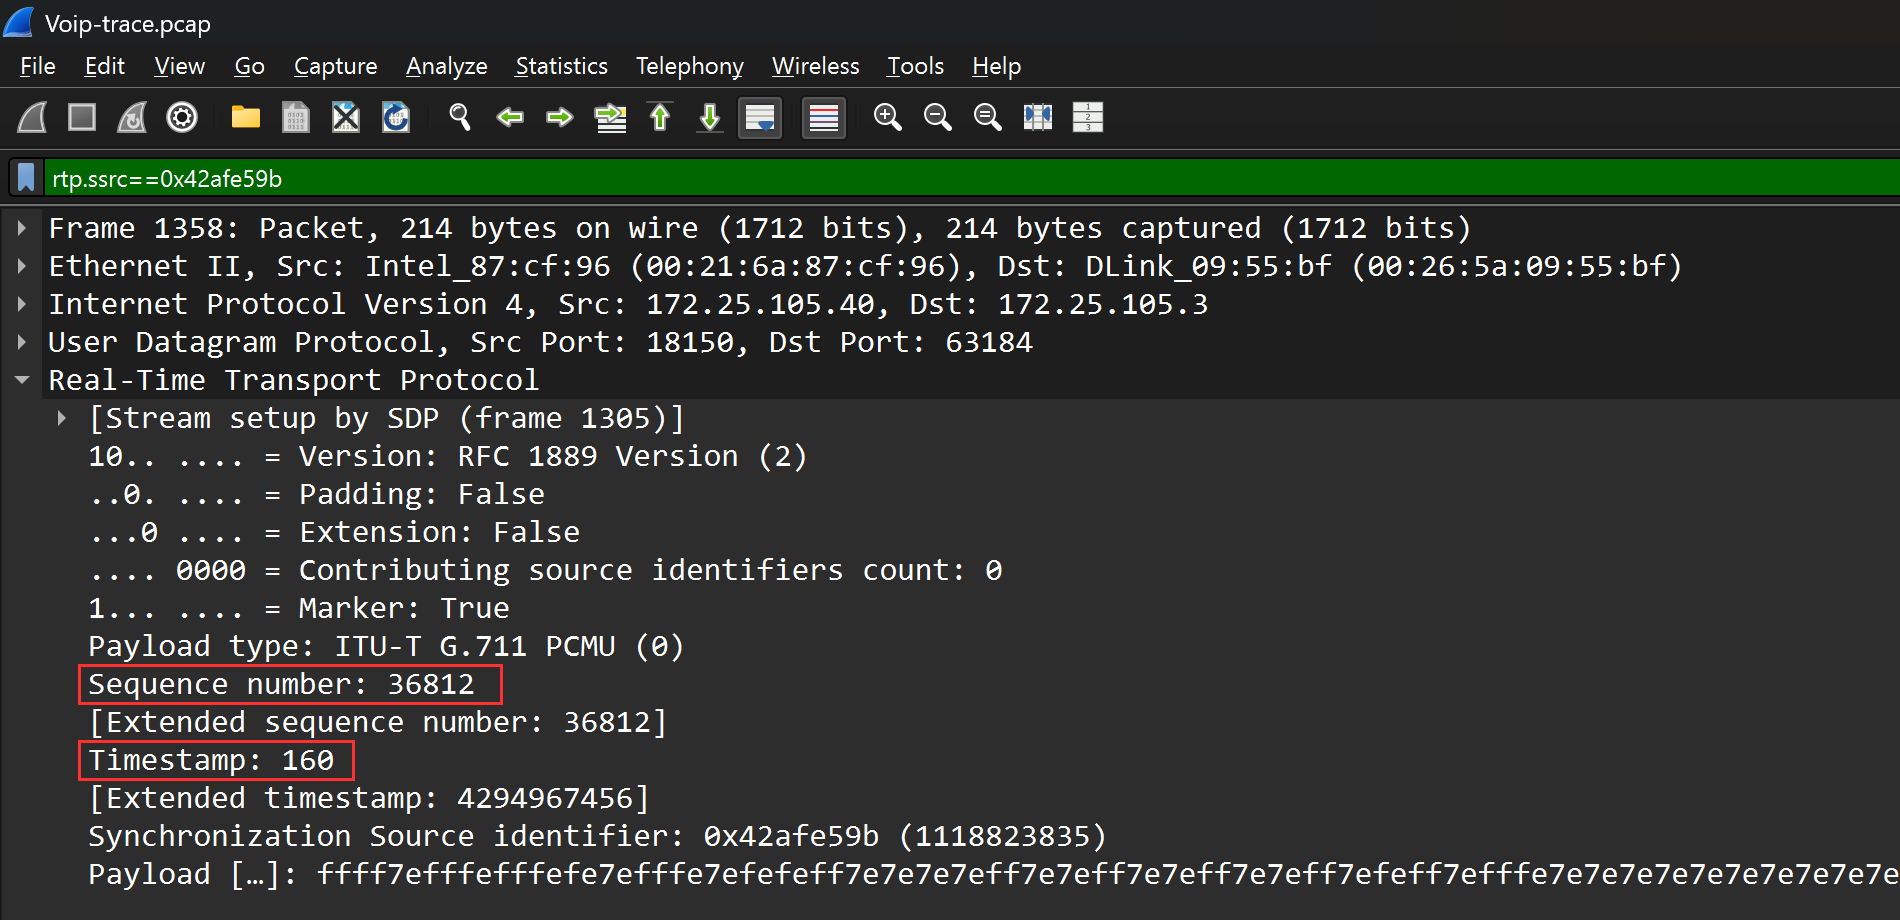
Select any RTP packet and expand Real-Time Transport Protocol so both counters are visible at the same time:
rtpThe boxes below mark the two candidates. The upper one is the packet counter. The lower one is the field tied to the media clock.
-
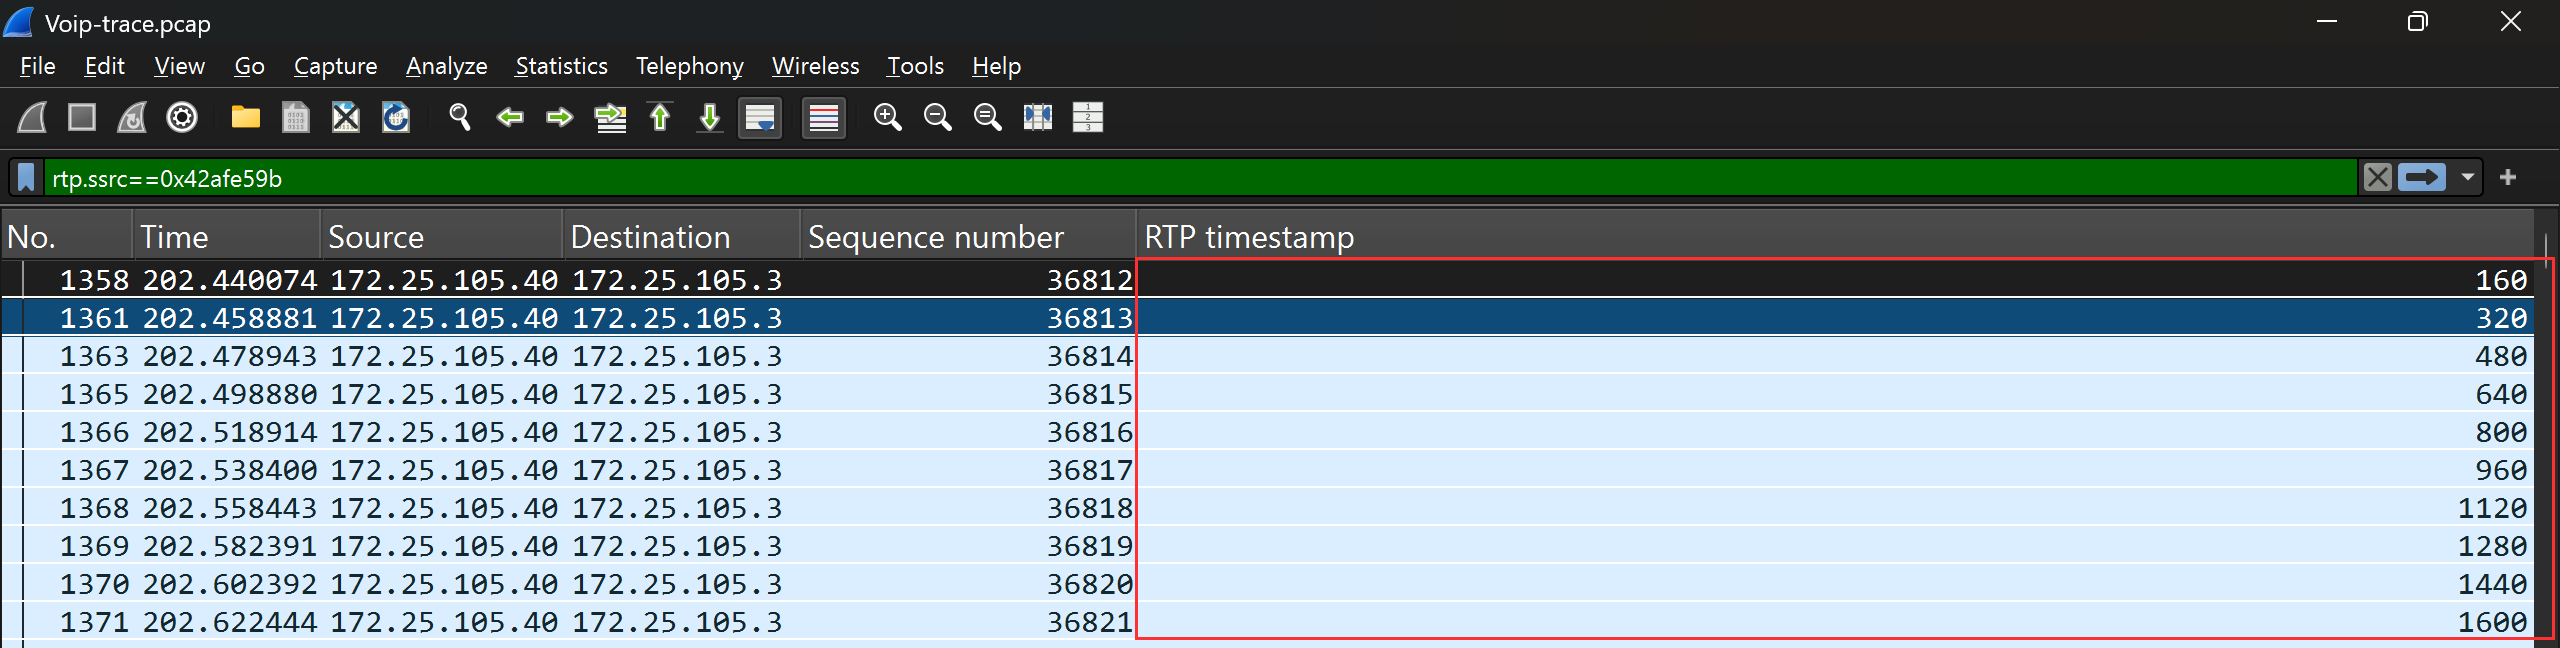
Add the timing field as a column and watch it across the stream. Where the packet counter steps by one, this one steps by a whole block of samples, because it measures media time rather than counting packets:
rtp.ssrc==0x42afe59b
-
Multiply one step of that field by the sampling time you calculated in Q11 and you get the twenty milliseconds of audio each packet carries. That product is the whole point of the field: it tells the receiver not merely that a packet arrived, but at what moment the samples inside it are due to be played.
-
Submit the name of the field carrying the sampling instant, as a single lowercase word.
Q14: The trace includes a secret hidden message. Can you hear it?
What do we need to know?
Nothing in this question is hidden in a cryptographic sense. The audio is unencrypted G.711, and Wireshark can decode RTP back into sound and play it through your speakers. The "hidden" part is simply that a packet capture does not look like audio until you ask the right tool to render it.
The one decision to make is which stream to play. There are two RTP streams, one in each direction. The one flowing from the PBX carries about twenty-six seconds of near-continuous speech. The one flowing back from the softphone is mostly silence with DTMF keypad tones near the end, so playing that direction will not get you the answer.
The message is a single spoken word, and it is a place name. Submit it in capitals, as the answer format implies.
How to do that?
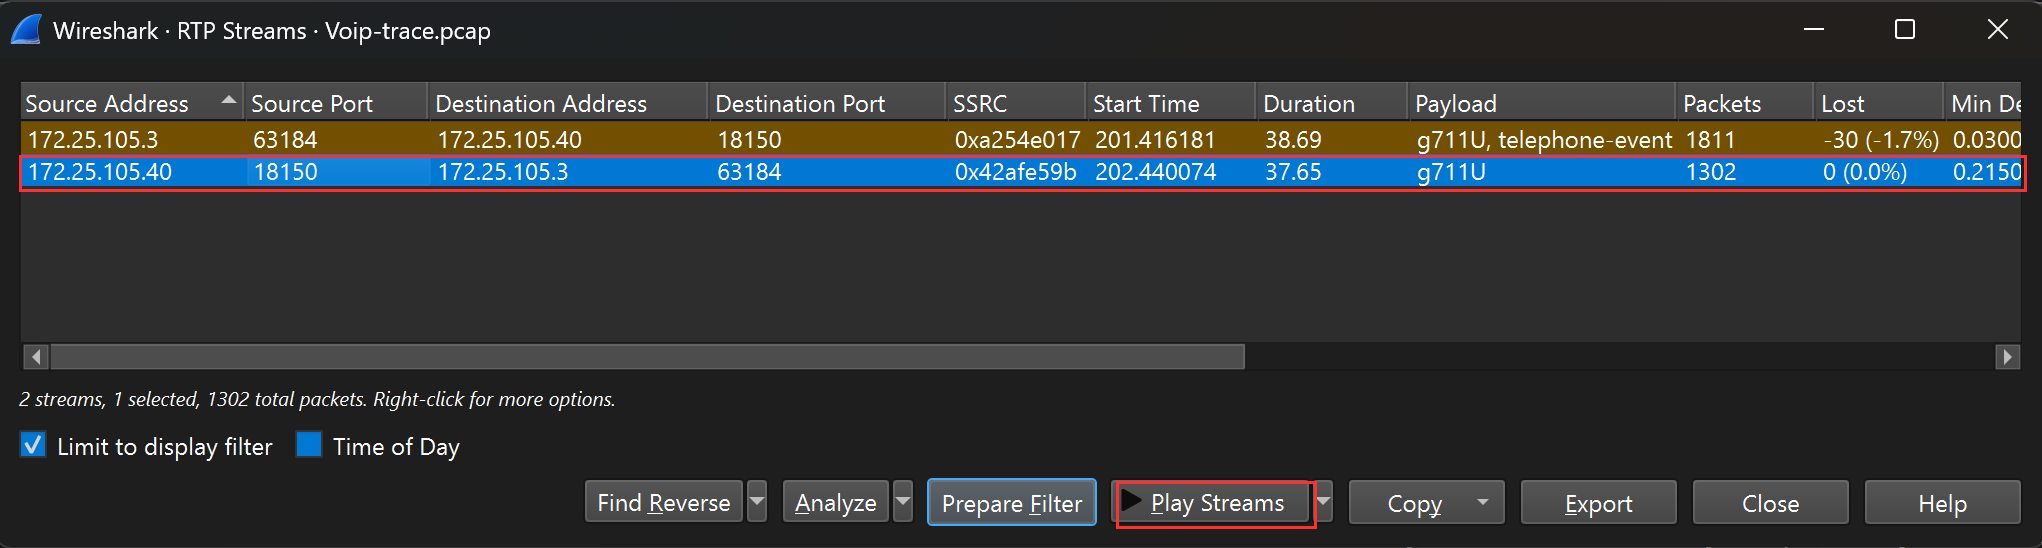
- Open Telephony > RTP > RTP Streams, then click the row whose Source Address is the PBX to select it. Selecting a stream is what enables the Play Streams button at the bottom of the window.
-
Click Play Streams. The RTP Player opens and draws the waveform of the stream you selected. Before playing anything, look at the shape: four clearly separated bursts of speech with silence between them, which is what a short spoken announcement looks like.
-
Press the play button and listen. If nothing comes out, check the Output Device dropdown at the bottom of the player and make sure it points at a device that is actually connected.
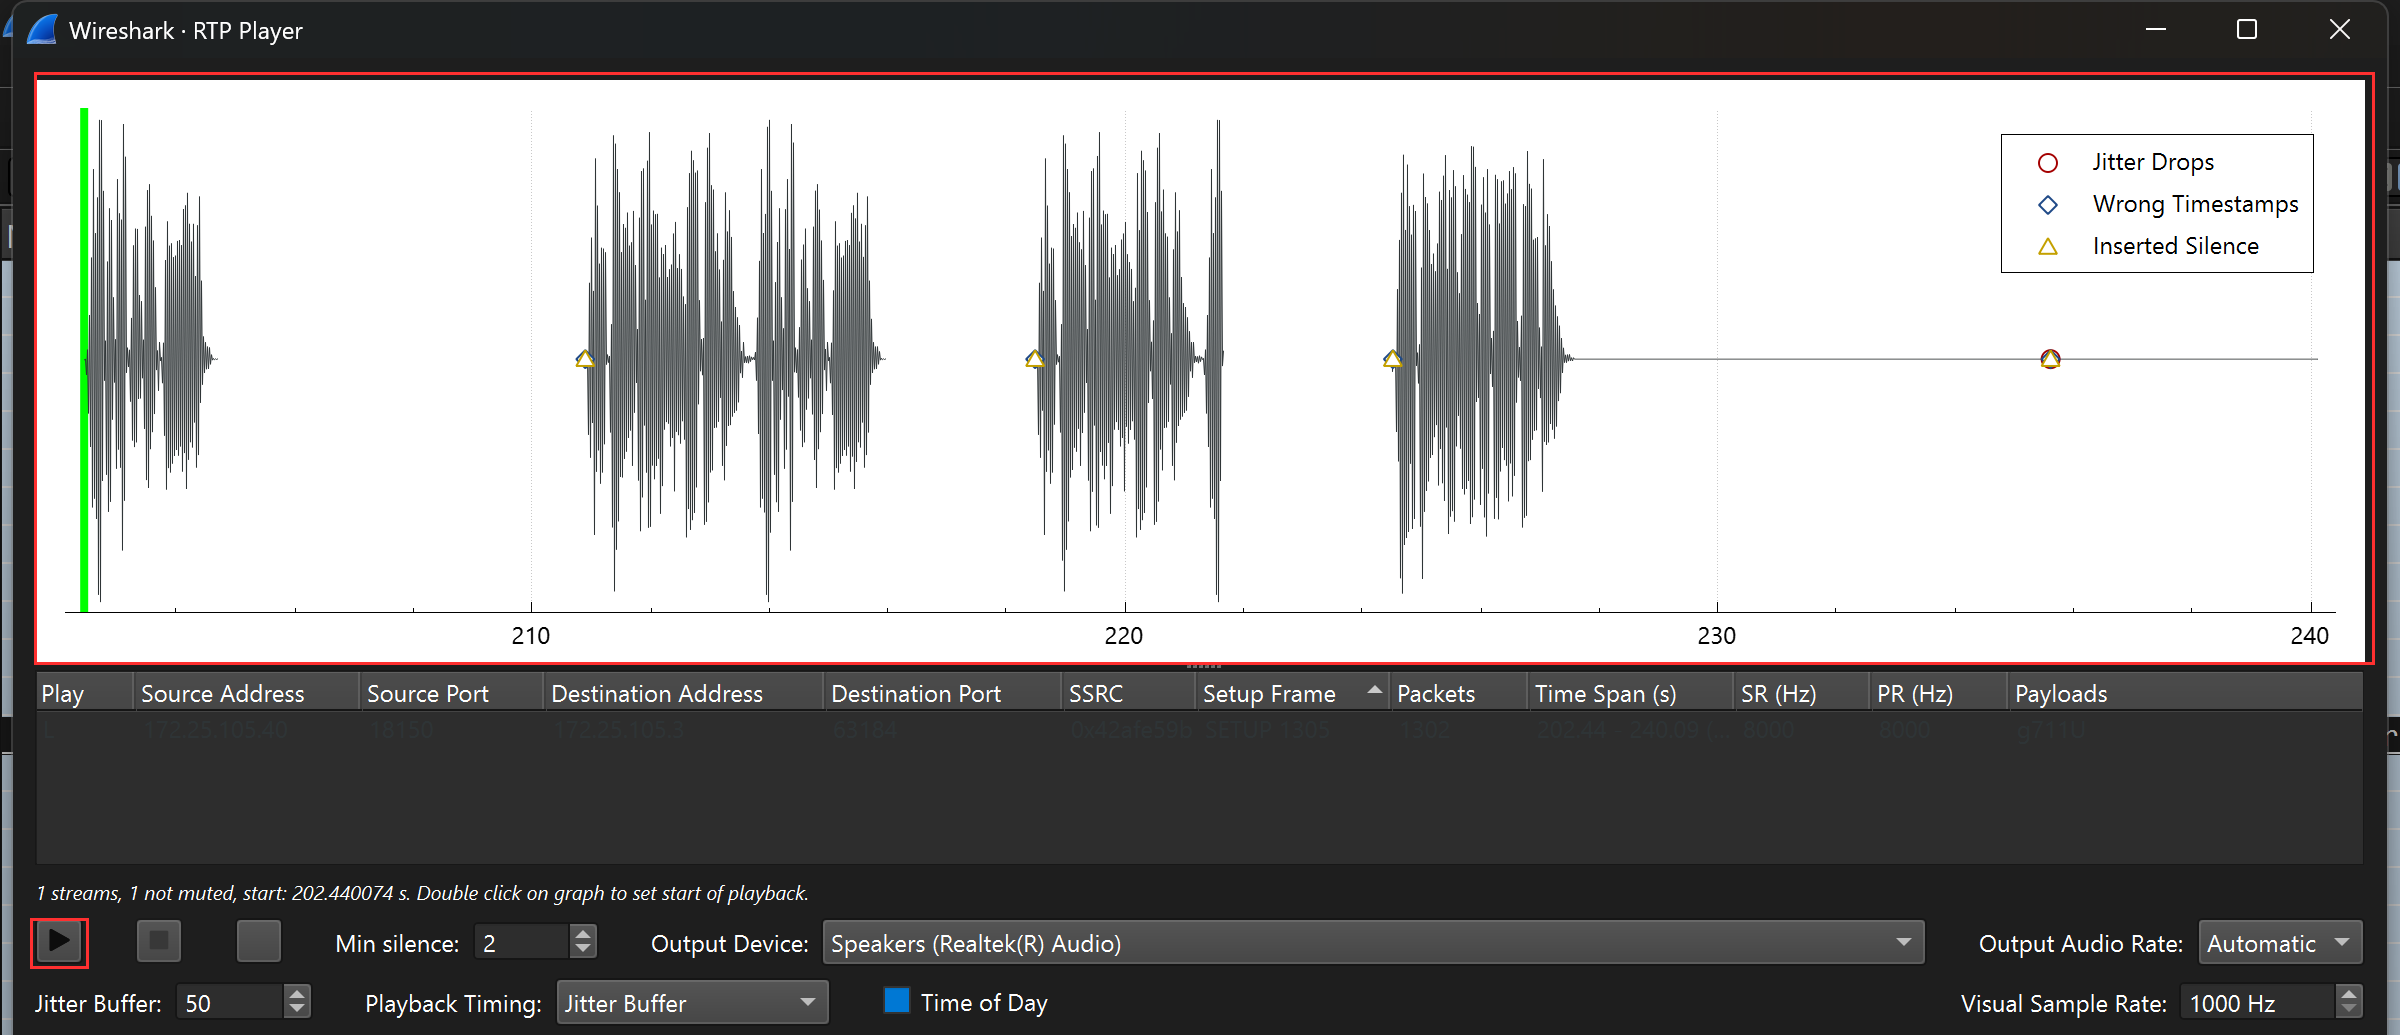
- The word is spoken clearly and repeated across the bursts, so play it more than once if you need to. Submit it in capitals with no punctuation.
Wireshark can also write the decoded audio out to a
.wavfile with the Export button in the player, which is useful if you want to listen in another application or slow the playback down.
Unlock Your Full Learning Experience with BlueYard Labs
Sign up to track your progress, unlock exclusive labs, and showcase your achievements—begin your journey now!
Join for Free